


Data analytics provides you with better supply chain visibility, helps you make business decisions backed by data insights, and helps you become more proactive in your supply chain management. Whether your company is small, midsize, or large, you can extract valuable insights from any amount of data. You just need to know how.
According to a Harvard Business Review Analytic Services survey in December 2020 of 191 business representatives in different industries, the main benefits businesses want to achieve by investing in data analytics are:
- improved operational efficiency (56 percent)
- improved customer experience (50 percent)
- new revenue streams or business opportunities (39 percent)
- increased innovation (30 percent)
As per the same survey, the operational efficiency actually realized by participants was 13 percent lower than expected. For customer experience, it was 22 percent lower; for revenue streams, a staggering 51 percent; and for increased innovation, an even more impressive 72 percent. Why is the gap between needs and actual realization so big? On the one hand, it has to do with each company’s approach to data analytics. On the other hand, such statistics prove that data analytics is well explored in theory but that many organizations still need support from business intelligence service providers to benefit from it in practice.
In this blog post, we share practical ways to analyze data in your organization using business intelligence and/or advanced analytics tools and techniques in the supply chain domain.


Checklist to determine whether you handle supply chain data correctly
Any kind of analysis supposes asking yourself critical questions. If you don’t do this either in life or in business, you’re heading nowhere. This is why we’ll begin with a set of questions to spot some major issues you might have with data management. If you answer no to at least one of the questions below, you’ll benefit from reading further:
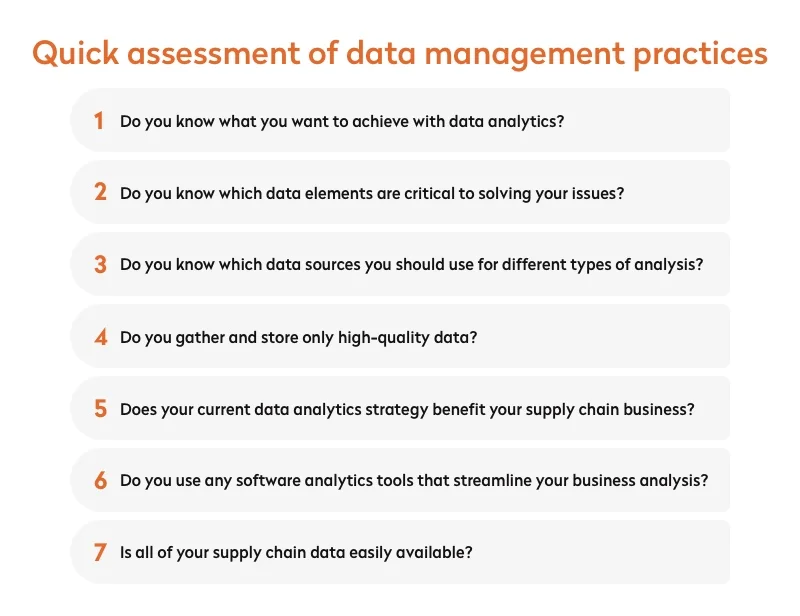
1. Do you know what you want to achieve with data analytics?
Define key bottlenecks in your company’s supply chain that you can solve with data analytics. Such bottlenecks could be manual inventory management and supply planning or delays in goods transportation. Then set a clear goal, such as “I want to achieve more accurate supply planning.”
2. Do you know which data elements are critical to solving your issues?
Once you’ve set clear goals for data analytics in your company, it’s time to identify key metrics that you’ll need to analyze. Such elements may include projected demand, available stock, and ETA dates. The complete set of data elements you should analyze depends on your goals, so always ask yourself if particular data provides insights into the issue you’re addressing.
3. Do you know which data sources you should use for different types of analysis?
To establish a proper data aggregation process in your company, you should first be aware of all the sources that generate valuable data. Say you want to have a comprehensive understanding of your procurement operations. For this, you might need relevant data not only from supply chain management systems but also from the sales and finance departments. In turn, sales data should come from the sales system and not from a warehouse management system.
4. Do you gather and store only high-quality data?
You might have legacy systems that generate irrelevant and low-quality data, or you may store outdated data that no longer does any good for your company. You can consider archiving certain datasets to eliminate data redundancy in your organization and focus only on collecting and storing up-to-date and high-quality data. You can also set up data quality software to validate key data characteristics.
5. Does your current data analytics strategy benefit your supply chain business?
You should overview your current approach to analyzing data and assess its effectiveness for your business over time. Using data science services, you can identify new opportunities and improve your analytics strategy to make more informed decisions. The main purpose of data analysis is to give you insights into how to improve or change your current services. If a supply chain business doesn’t progress over time thanks to data analytics, then it’s necessary to upgrade current analytics practices to more advanced ones.
6. Do you use any software analytics tools that streamline your business analysis?
Software solutions facilitate business and data analytics processes and eventually help you yield much better business insights than what you can gain with manual data analytics.
7. Is all of your supply chain data easily available?
A lack of data centralization and integration between different siloed business systems and applications makes it harder to conduct comprehensive business analysis.
If you get more nos than yeses when answering the questions above, we suggest you start by implementing a business intelligence solution. Once you feel you’re on solid ground with your business intelligence (BI) data analytics, it would be just about time to implement advanced analytics. However, if BI is already familiar to you, you can immediately start with advanced analytics. Let’s find out how business intelligence is different from advanced analytics.
Difference between business intelligence and advanced analytics
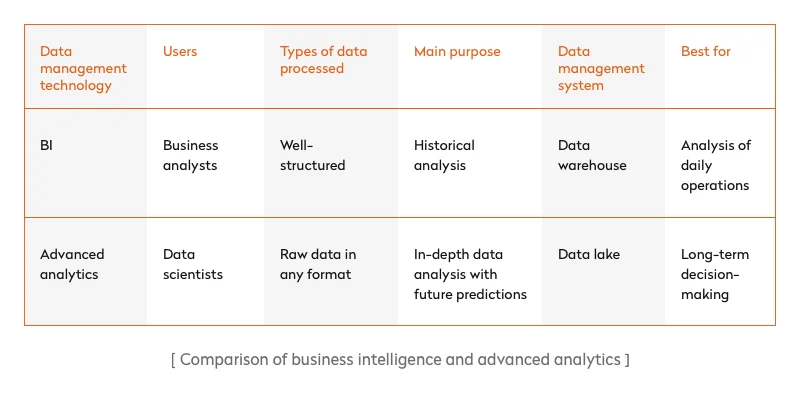
Business intelligence and advanced analytics are sometimes used interchangeably. As BI solutions improve, they can resemble advanced analytics solutions. In this article, we differentiate these two concepts, however, as at their core they have different purposes.
Business intelligence tools allow for creating reports, dashboards, and other data visualizations based on well-structured data. Structured data includes dates, names, numbers, addresses, and other quantitative records that are highly organized, categorized, and easily accessible. Business analysts use BI tools to analyze historical data and describe patterns that brought the company to its current state.
Advanced analytics tools allow for analyzing big chunks of structured, semi-structured, and unstructured data (big data) as well as real-time data. For example, data and BI in the food industry can be utilized to enhance operational efficiency and decision-making processes. Advanced analytics makes use of leading technologies such as machine learning solutions, artificial intelligence, and deep learning, and it integrates with IoT devices. With advanced analytics services, data scientists can forecast performance in any business area.
Read also: Guide to Real-time Data Processing
BI use cases in supply chain management
Below are ways you can use business intelligence for your supply chain analytics:
Generate insights from structured supply chain data
BI software can make use of raw data in Excel spreadsheets, transportation management systems (TMSs), and order management systems (OMSs) and can create reports — for instance, to compare business performance over time by analyzing the number of orders and deliveries per month.
Real-life example: Wascosa, a Swiss supplier of railway freight wagons, has developed a self-service B2B customer portal called WASCOSA Net based on a BI solution. This portal generates dashboards and reports for Wascosa clients so they can always be aware of the current condition of their wagon fleet. The BI solution has increased customer satisfaction and increased Wascosa’s competitiveness in the rail freight industry. You can also get familiar with Yalantis’ experience developing a logistics customer portal.
Better manage day-to-day operations and work
BI tools are focused on past data, and based on it they create descriptive reports and dashboards. These reports and dashboards can help you make better decisions to improve daily supply chain operations.
Real-life example: Arani, a Canadian manufacturer and distributor of LED lighting products, was struggling with lots of errors in manually managed reports in Excel and Microsoft Asset that included data on net monthly sales, returns, and gross profit margins. The company implemented BI software for supply chain analytics to automatically generate accurate reports that could help the supply chain management team make well-informed business decisions on the fly.
Read also: Our Case Study on Creating a Real-Time Election Data Processing Solution
Advanced analytics use cases in supply chain management
According to Gartner, by 2024, 50 percent of supply chain companies will have adopted software with advanced analytics capabilities. Advanced analytics provides you with literally millions of data analysis combinations. And if you choose to adopt this solution, you’ll need a data scientist in your company to show you the vast possibilities of this data analysis approach. Let’s see to which supply chain areas advanced analytics applies:
Read also: Management by Exception Software in Logistics: Requirements and Must-Have Functionality
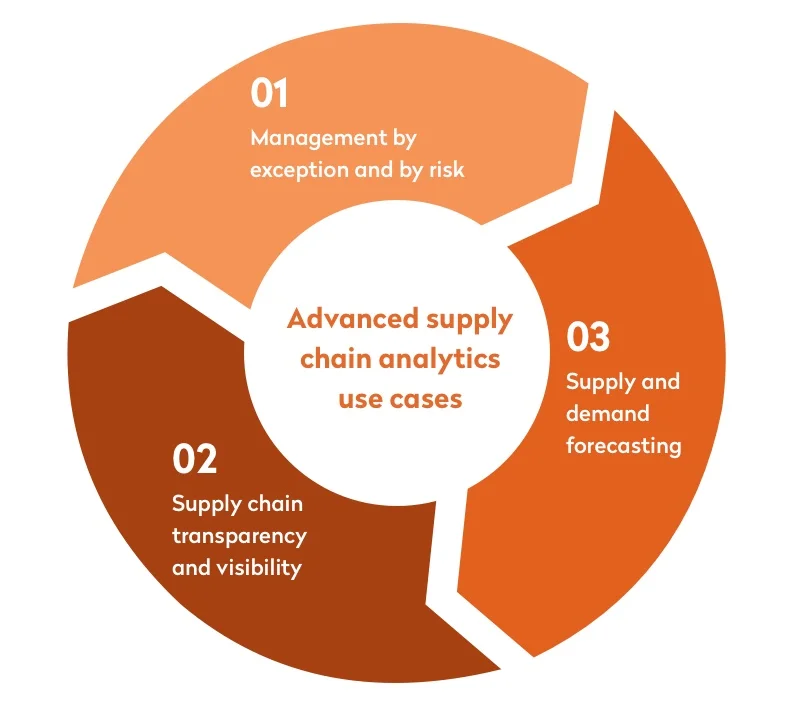
Management by exception and by risk
Advanced supply chain analytics technology has more of a predictive and prescriptive nature thanks to the bigger variety of data they can process and the technologies data scientists can use, such as machine learning (machine learning business use cases). Thus, advanced analytics tools can provide better results in identifying risks such as interruptions in product supply based on economic news or weather forecasts.
Real-life example: In 2016, a typhoon threatened a few of Cisco’s transportation hubs. Thanks to risk management software enhanced with advanced analytics capabilities, Cisco’s data analysts were able to define which shipments were at risk of damage or delay. Eventually, customers were notified of the delay far in advance while their deliveries were kept at a safe place during the natural disaster.
Supply and demand forecasting
Similar to risk management, advanced analytics is also suitable for forecasting and planning supply and demand. For instance, based on seasonal spikes in product demand, data scientists can predict the supply volume for the same period next year.
Elaborate data analysis can also help companies predict realistic demand fluctuations and avoid a bullwhip effect. The latter happens when logistics companies stock their warehouses with a certain product due to an unexpected and quick rise in consumer demand which later just as quickly declines, leaving warehouses with overstock.
Real-life example: Franprix, a French retailer, struggled with manual stock replenishment that often led to either overstocks or stockouts in stores. Thanks to adopting demand forecasting based on AI and machine learning algorithms, Franprix achieved a 67 percent decrease in stockouts and a 30 percent decrease in fresh food waste.
Supply chain transparency and visibility
With the possibility to analyze large datasets, logistics managers can provide their clients with exceptional services. For instance, GPS devices on vehicles and containers can provide real-time data on the exact locations of shipments. RFID tags or IoT devices can provide data on current cargo conditions (e.g. whether the temperature in a container or truck meets the requirements for transporting perishable goods).
Based on that data and with the help of advanced analytics, data scientists can define the most accurate estimated time of delivery (ETD) for different types of shipments as well as predict the possibility of disruptive events.
Real-life example: A large German manufacturer of cutting machine tools, DMG MORI, is using data from IoT sensors and an advanced analytics platform, supported by IoT data analytics software, to monitor the quality of their products and deliver timely assembly services for their clients.
Depending on your business objectives, you can choose either business intelligence or advanced analytics tools. Or you can always opt for both if they both can fulfill your current supply chain management analytics needs.
Read also: How Can an IoT Provider Ensure Remote Management of Large Device Networks?
BI implementation roadmap
If your choice falls on business intelligence, we’ll help you figure out where to start. As we’ve mentioned earlier, supply chain BI tools process structured data. To make the most of it, you’ll need a solution that can aggregate all the structured data in your organization. It’s also possible to manually upload data to the BI platform, but that’s time-consuming, and you may forget to add some crucial data.
Thus, we recommend you develop a data warehouse (DW). A DW is a data repository that in combination with an ETL (extract, transfer, load) engine can collect all structured data from internal and external sources and serve as a single source of truth. The data in a DW is well categorized and easily accessible for further analysis. If you build a data warehouse software architecture, you won’t need to manually collect structured data or search for it in your organization’s databases to extract it for analysis.
After implementing a data warehouse solution, you can integrate it with your BI platform to automatically upload data. There are two options for doing this: you can develop a custom business intelligence solution or choose a ready-made one.
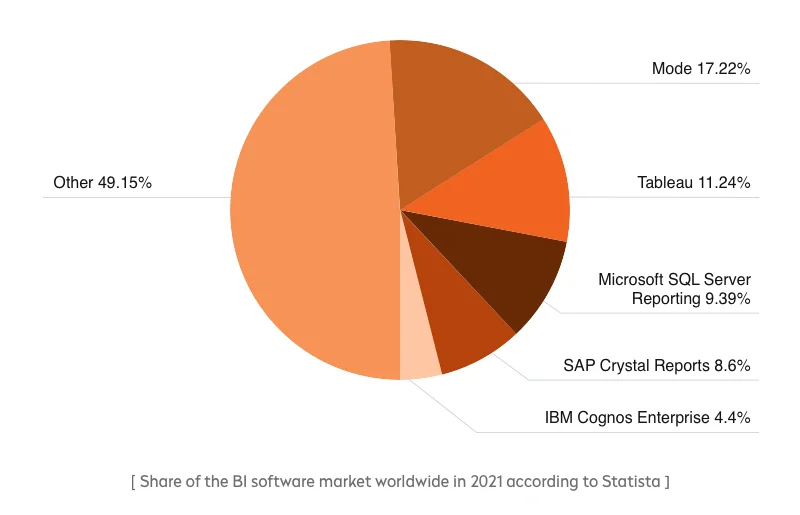
Option #1. Ready-made solution
Let’s first review off-the-shelf BI platforms. The chart below by Statista shows the top five business intelligence solutions. We’ll take a closer look at two of them: Mode and Tableau. We’ve chosen these platforms as Mode is the leader in market share, while Yalantis business analysts have a proven track record of working with Tableau.
Mode
Mode is a modern BI solution for business and data analysts to transform raw data into valuable insights. Mode provides analysts with:
- an SQL (structured query language) editor to retrieve, manage, or change structured data they need to analyze
- an HTML, CSS, and JavaScript editor to customize reports and dashboards
Pros:
- Templates with calculated formulas to reuse in multiple reports
- Customizable data visualization tools (data visualization as a service)
- A wide variety of visualization templates including chart heights, histograms, funnel charts, and horizontal bar charts
- Ability to embed analytics in any application
- Scheduled report sharing within the organization, even in Slack
- Basic free version for individual use
- Training materials (but only for business and enterprise customers)
Cons based on customer reviews:
- The basic free version is limited and doesn’t even allow for the easiest manipulations with reporting and dashboarding
- If a report has many queries, visuals, and charts, it takes the platform a long time to generate it
- Deep-dive training is required to start creating reports and dashboards
- Not responsive and intuitive
Tableau
Tableau is a progressive enterprise business intelligence platform. Apart from data visualization capabilities, Tableau offers clients a wide variety of solutions that prepare them for efficient data analysis. For instance, there are tools such as Tableau Data Management and Tableau Catalog for ensuring that analysts use relevant and up-to-date data for analysis.
Pros:
- All-round support with data handling and analysis apart from BI capabilities
- Data extraction either from on-premises or cloud databases
- Possibility to use Tableau as a SaaS solution for self-service analytics available for everyone and on any device across the enterprise
- Intuitive and easy-to-use drag-and-drop interface to create custom charts and dashboards without any coding skills
- Knowledge sharing within the Tableau community of data analysts
Cons based on customer reviews:
- Steep learning curve for many analysts to get started with the platform, as it offers lots of BI features
- Slow response time when analyzing large datasets
- Login is required every time an enterprise employee opens a shared file
- Can be difficult to update Tableau dashboards with new information
- Arranging components on a dashboard is an overwhelming and complicated process
Option #2. Custom solution
If you’re reluctant to agree on integration with a ready-made BI platform, you can always choose to develop a custom one. When building a custom BI solution, you can get the following benefits:
- Quick and smooth integration with your data warehouse to extract any data you need
- UI/UX specifically designed for business analysts in your enterprise
- Customized feature set right from the start and no need to learn how to modify the system to fit your needs
- Scalability to the extent you need and the possibility to add more advanced functionality over time
If business intelligence solutions don’t seem enough to cover all of your supply chain management digitization needs, read further to find out how you can set up an advanced data analytics solutions flow.
Advanced analytics implementation roadmap
Just as with business intelligence, the first step in acquiring an advanced analytics toolset and making the most of it is to build an advanced data infrastructure such as a data lake (DL). A data lake extracts, loads, and transforms all data types including structured, semi-structured, unstructured, and binary data. Thus, it offers a much bigger pool of data than a data warehouse.
A DL fits perfectly for companies that have lots of internal and external data sources and can’t properly organize all of them to transfer data into a single source of truth. Thus, a DL can become a single data storage location within a company. A DL infrastructure is also great for collecting and storing data from IoT sensors. Advanced analytics solutions integrate with a DL to get the necessary raw data for analysis.
To implement this complicated yet rewarding data analytics solution, you can integrate with Amazon QuickSight, Azure Machine Learning, Google Cloud Prediction API, or RapidMiner. This list goes on, as there are many advanced analytics solutions and it may be frustrating to get things straight. It’s best to get support in choosing the best development and deployment path, especially from a provider offering big data services to handle large-scale data processing efficiently.
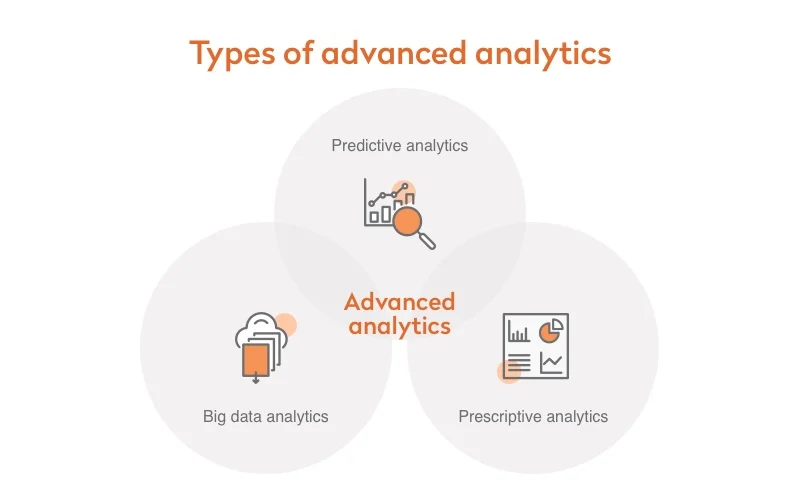
Advanced analytics includes three major types: big data, predictive, and prescriptive.
Big data analytics
As the adoption of digital solutions is proliferating and the number of data sources is only growing in supply chain management, big data analytics helps to make sense of these large data sets. Big data analytics refers to any analysis (descriptive, diagnostic, predictive, prescriptive), but only with large data sets.
Yalantis has developed a big data and advanced analytics solution for a 3PL company based on a layered component-oriented architecture with a data lake as a single source of truth (data lake benefits). Our solution collects and stores all types of data in the company and enables data scientists to conduct advanced business analysis using Amazon QuickSight and Amazon SageMaker.
Read also: How to Implement the Most Suitable Software Architecture for Your Business
Predictive analytics
This type of analytics involves modeling techniques and algorithms from artificial intelligence, machine learning, and statistical analysis to predict the probability of events and their possible consequences. For instance, based on real-time data from IoT devices, analysts can forecast equipment maintenance in the manufacturing industry. Or pharmaceutical companies can keep their inventory levels in line with variable demand considering historical data and transactional data on consumer demand or real-time data on disease outbreaks.
Prescriptive analytics
Prescriptive analytics provides you with actions you can take to either avoid certain risks or better prepare for changes. Prescriptive analytics takes into account findings from the descriptive (BI level) and predictive analytics to make concise prescriptions for supply chain process optimization.
To provide accurate outcomes, data analysts make use of machine learning, image processing, computer vision, and simulation techniques. Simulation technology, for instance, can help analysts conduct an insightful what-if analysis when a company plans to expand its supply chain services to other countries.
A few final tips
Data analytics aims at making all your organization’s raw data meaningful so it can drive profit for your company. However, without skilled employees like business analysts and data scientists, it’ll be hard to distinguish which data you should analyze and which you don’t even need to collect. Thus, consider hiring either business analysts or data scientists with extensive data analytics experience.
It’s also worth collaborating with an experienced software development partner to set up a working data management flow that can enable a streamlined data analysis process. Explore our big data and analytics services to see how we can help optimize your supply chain management and maximize supply chain efficiency.
Need a custom data analytics solution?
Our team is eager to help
About the author