
From data chaos to control in 3 months: How a growing 3PL maximized data value with a big data analytics solution
With a streamlined big data analytics flow, a US third-party logistics (3PL) company increased customer satisfaction, improved supply chain decision-making, and reduced operational costs in 3 months.
Project success highlights
-
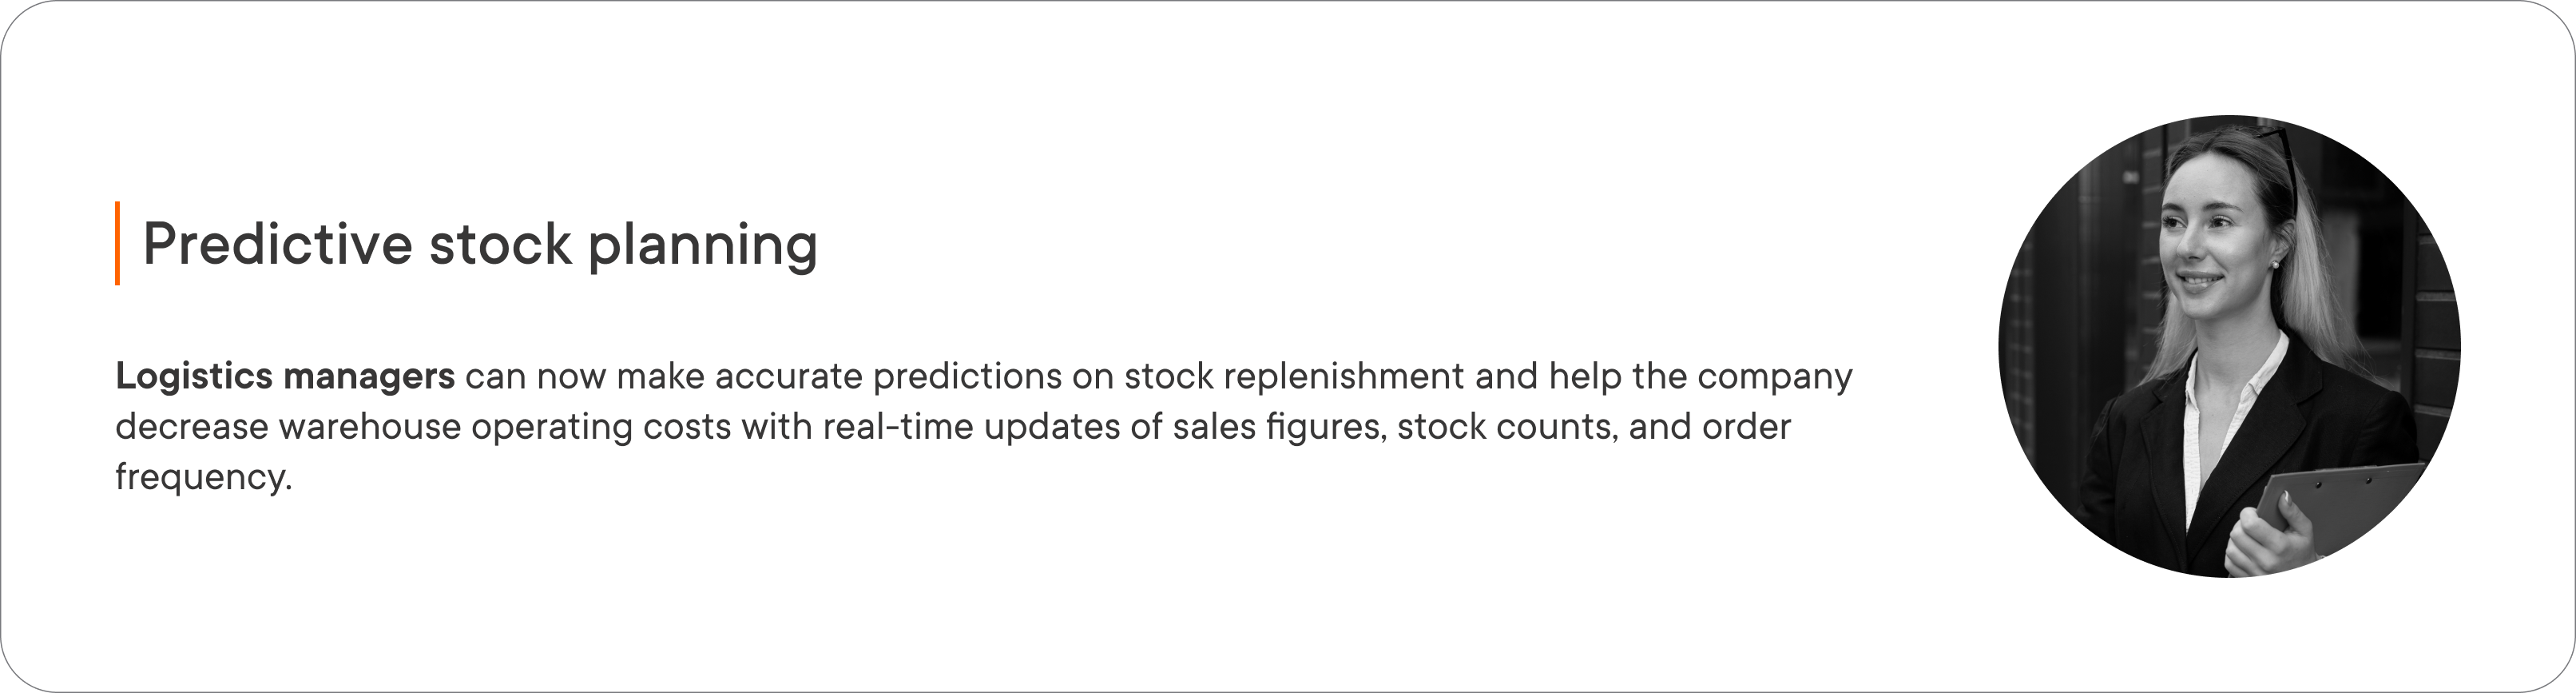
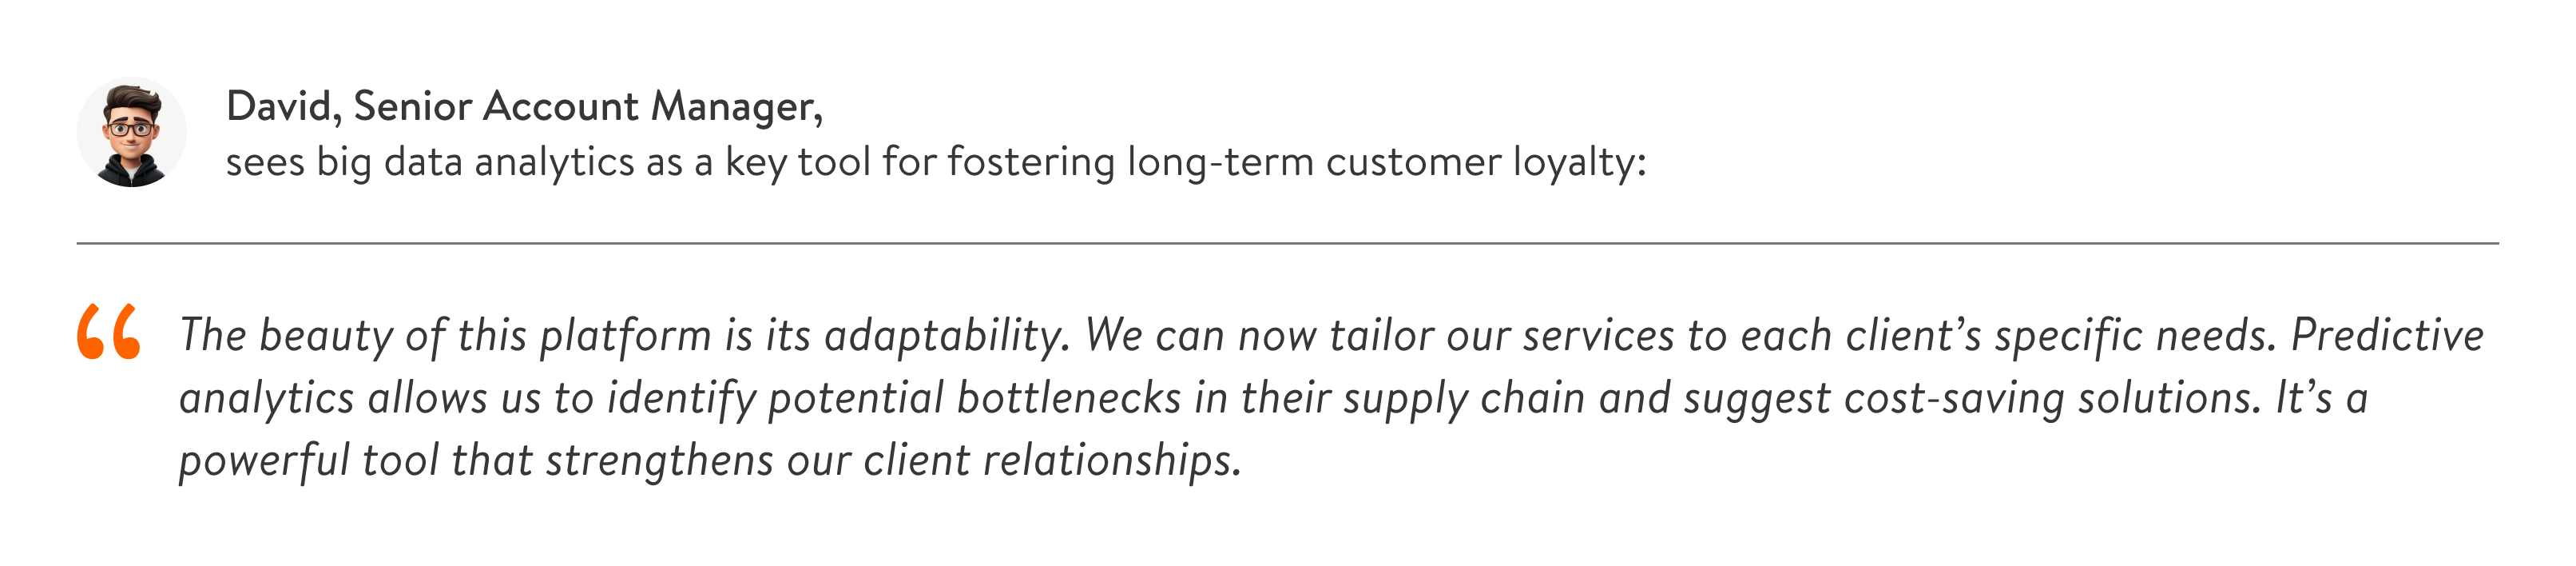
The Yalantis team developed a custom big data analytics platform for efficient business data analysis and helped different managers at the 3PL company expand their capabilities in the following ways


Story of partnership
-
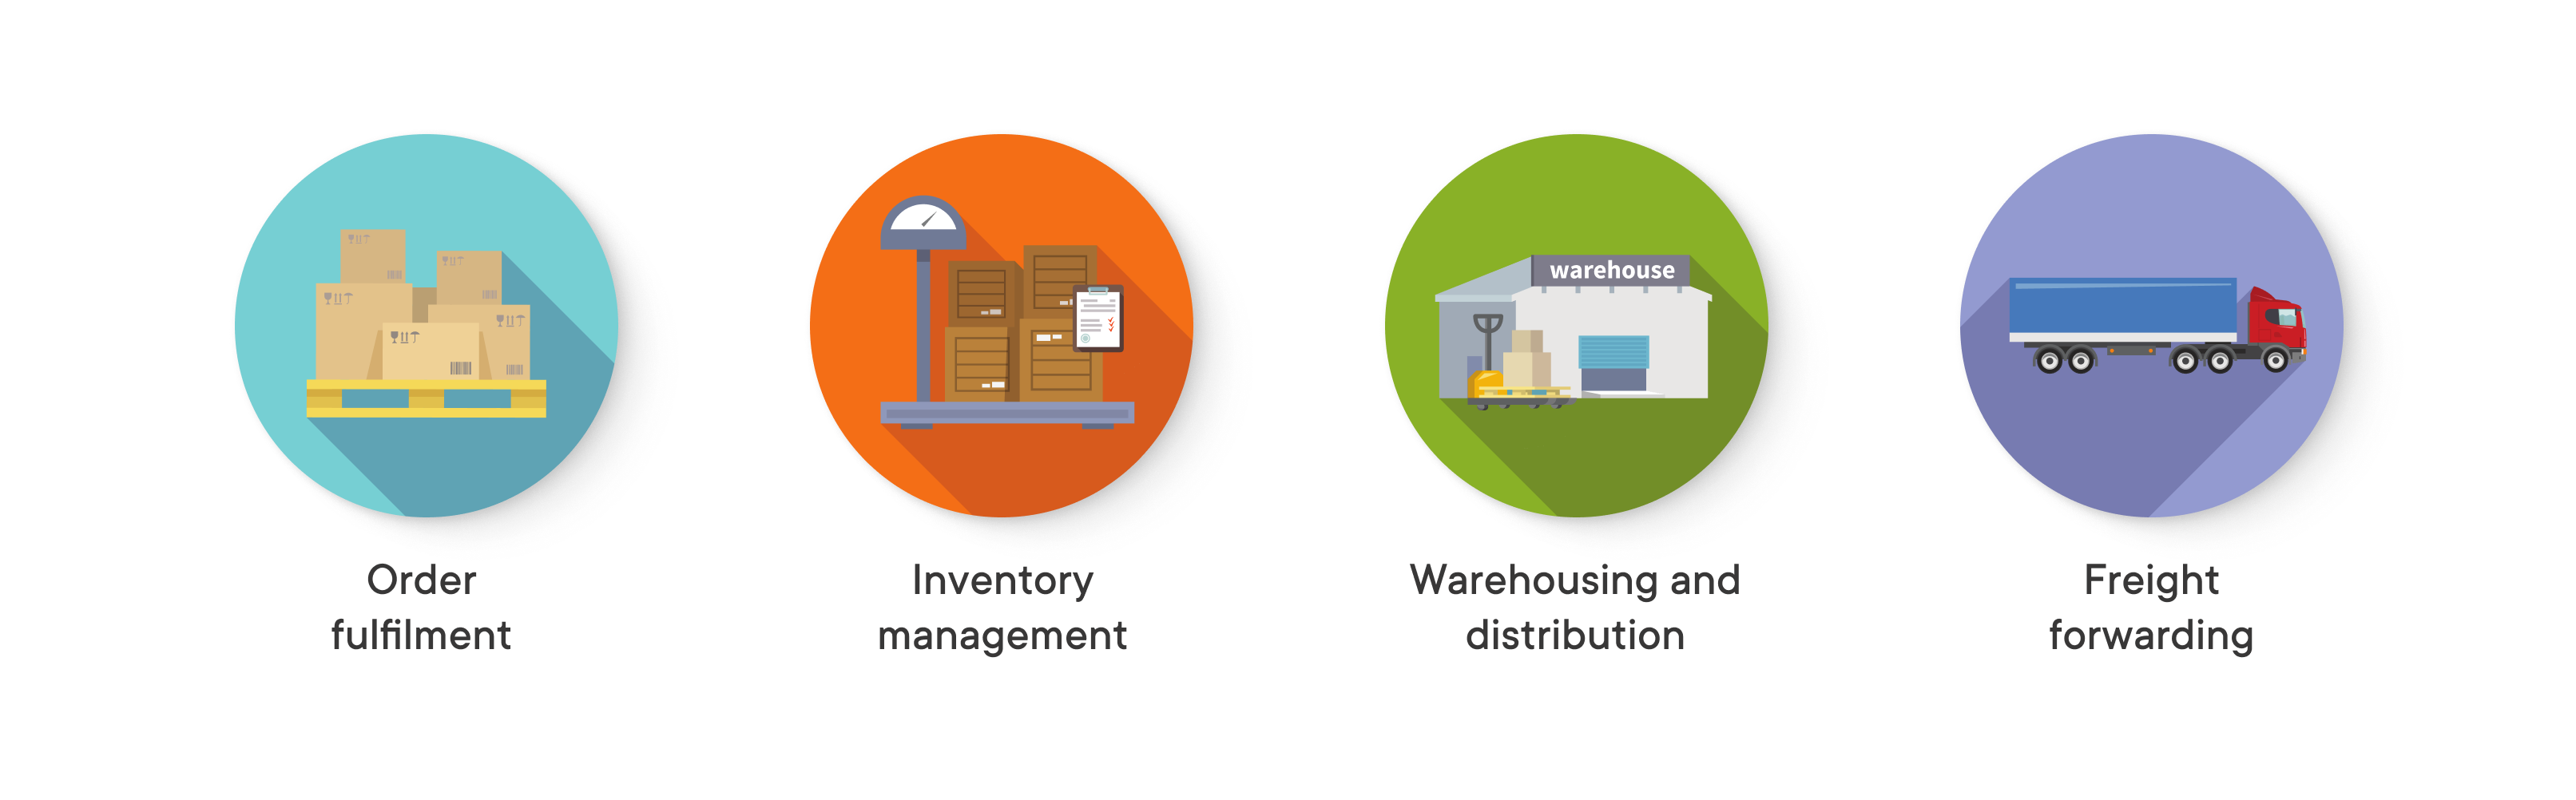
In 2021, the Yalantis team cooperated with a US-based third-party logistics (3PL) company that provides their customers with efficient services:

When providing these services, the company puts their customers’ needs first and aspires to deliver beyond expectations to increase customer loyalty, win the market, and build up their brand. They prioritize shipment and order fulfillment visibility and strive for continuous optimization of their daily operations to deliver top-notch logistics services.
Challenges disputing daily workflow
-
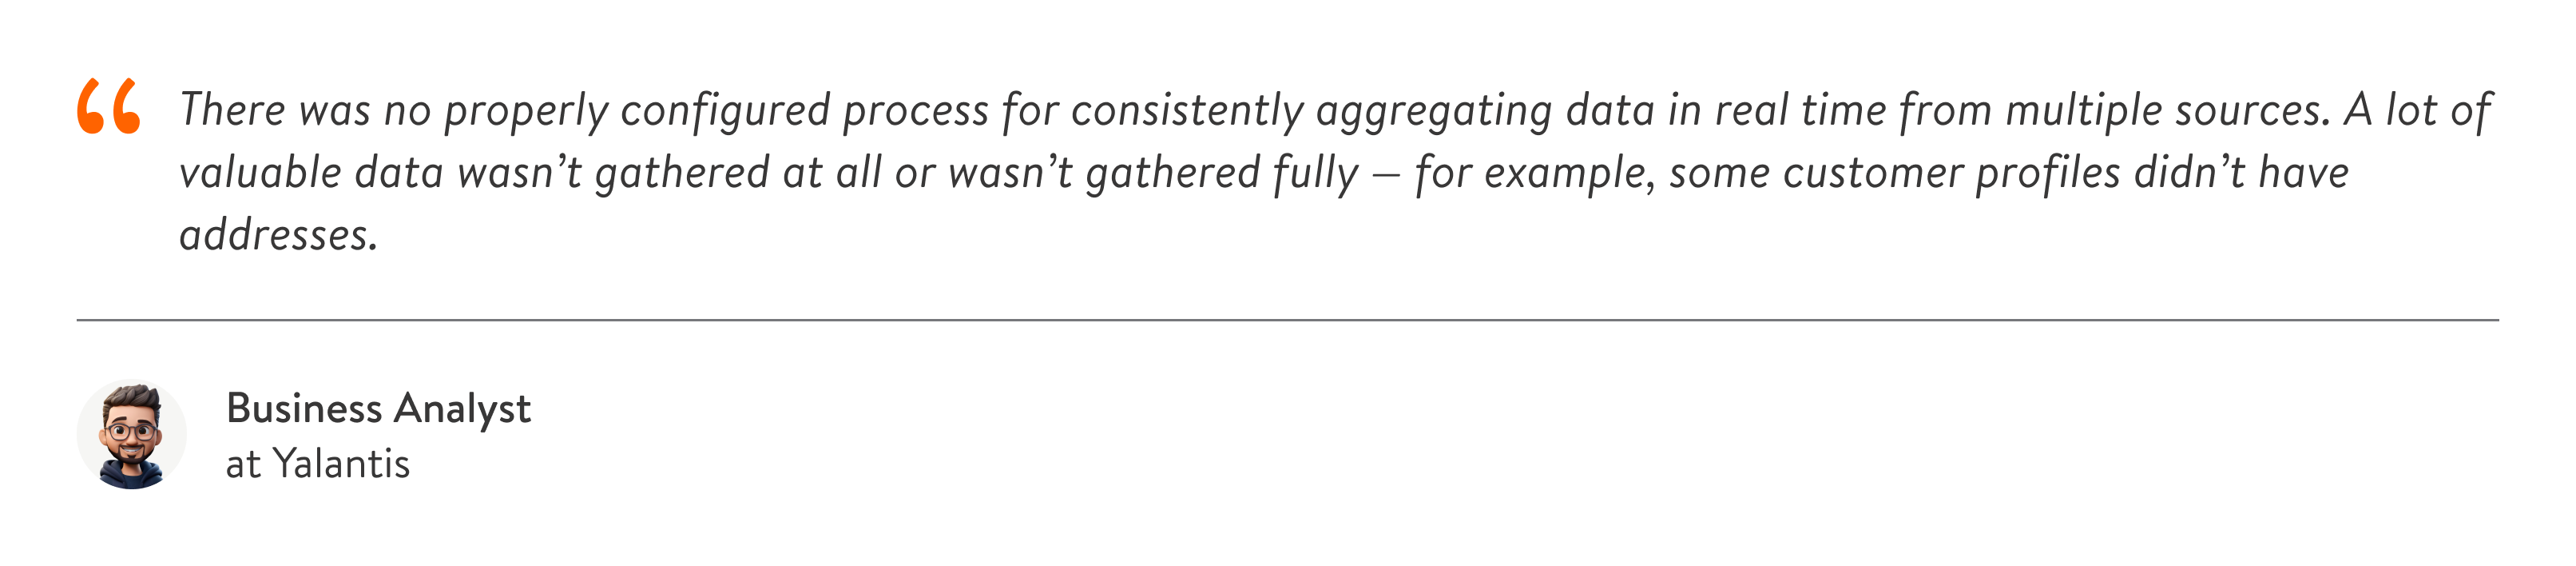
The 3PL company needed an efficient data analytics solution to convert raw data from multiple sources such as customer logs, supply chain systems, RFID tags, and IoT devices into valuable information to support decision-making. In achieving this, they faced several challenges:
- Incomplete data due to a lack of an efficient process for aggregating data from multiple sources in real time
- Ineffective analysis of large amounts of unstructured data due to the absence of an advanced data analytics system
- Poor accessibility to supply chain data siloed in separate departments
To efficiently tackle our partner’s challenges, our team started working on a custom big data analytics platform.
Incoherent data can disrupt your daily operations more than you imagine
Get a thorough data infrastructure assessment and discover a cost-effective way to streamline operations with an architecture overhaul.
Solution overview
-
Big data solution for 3PL: Implementing 4 core components
The Yalantis team integrated the following big data analytics components:

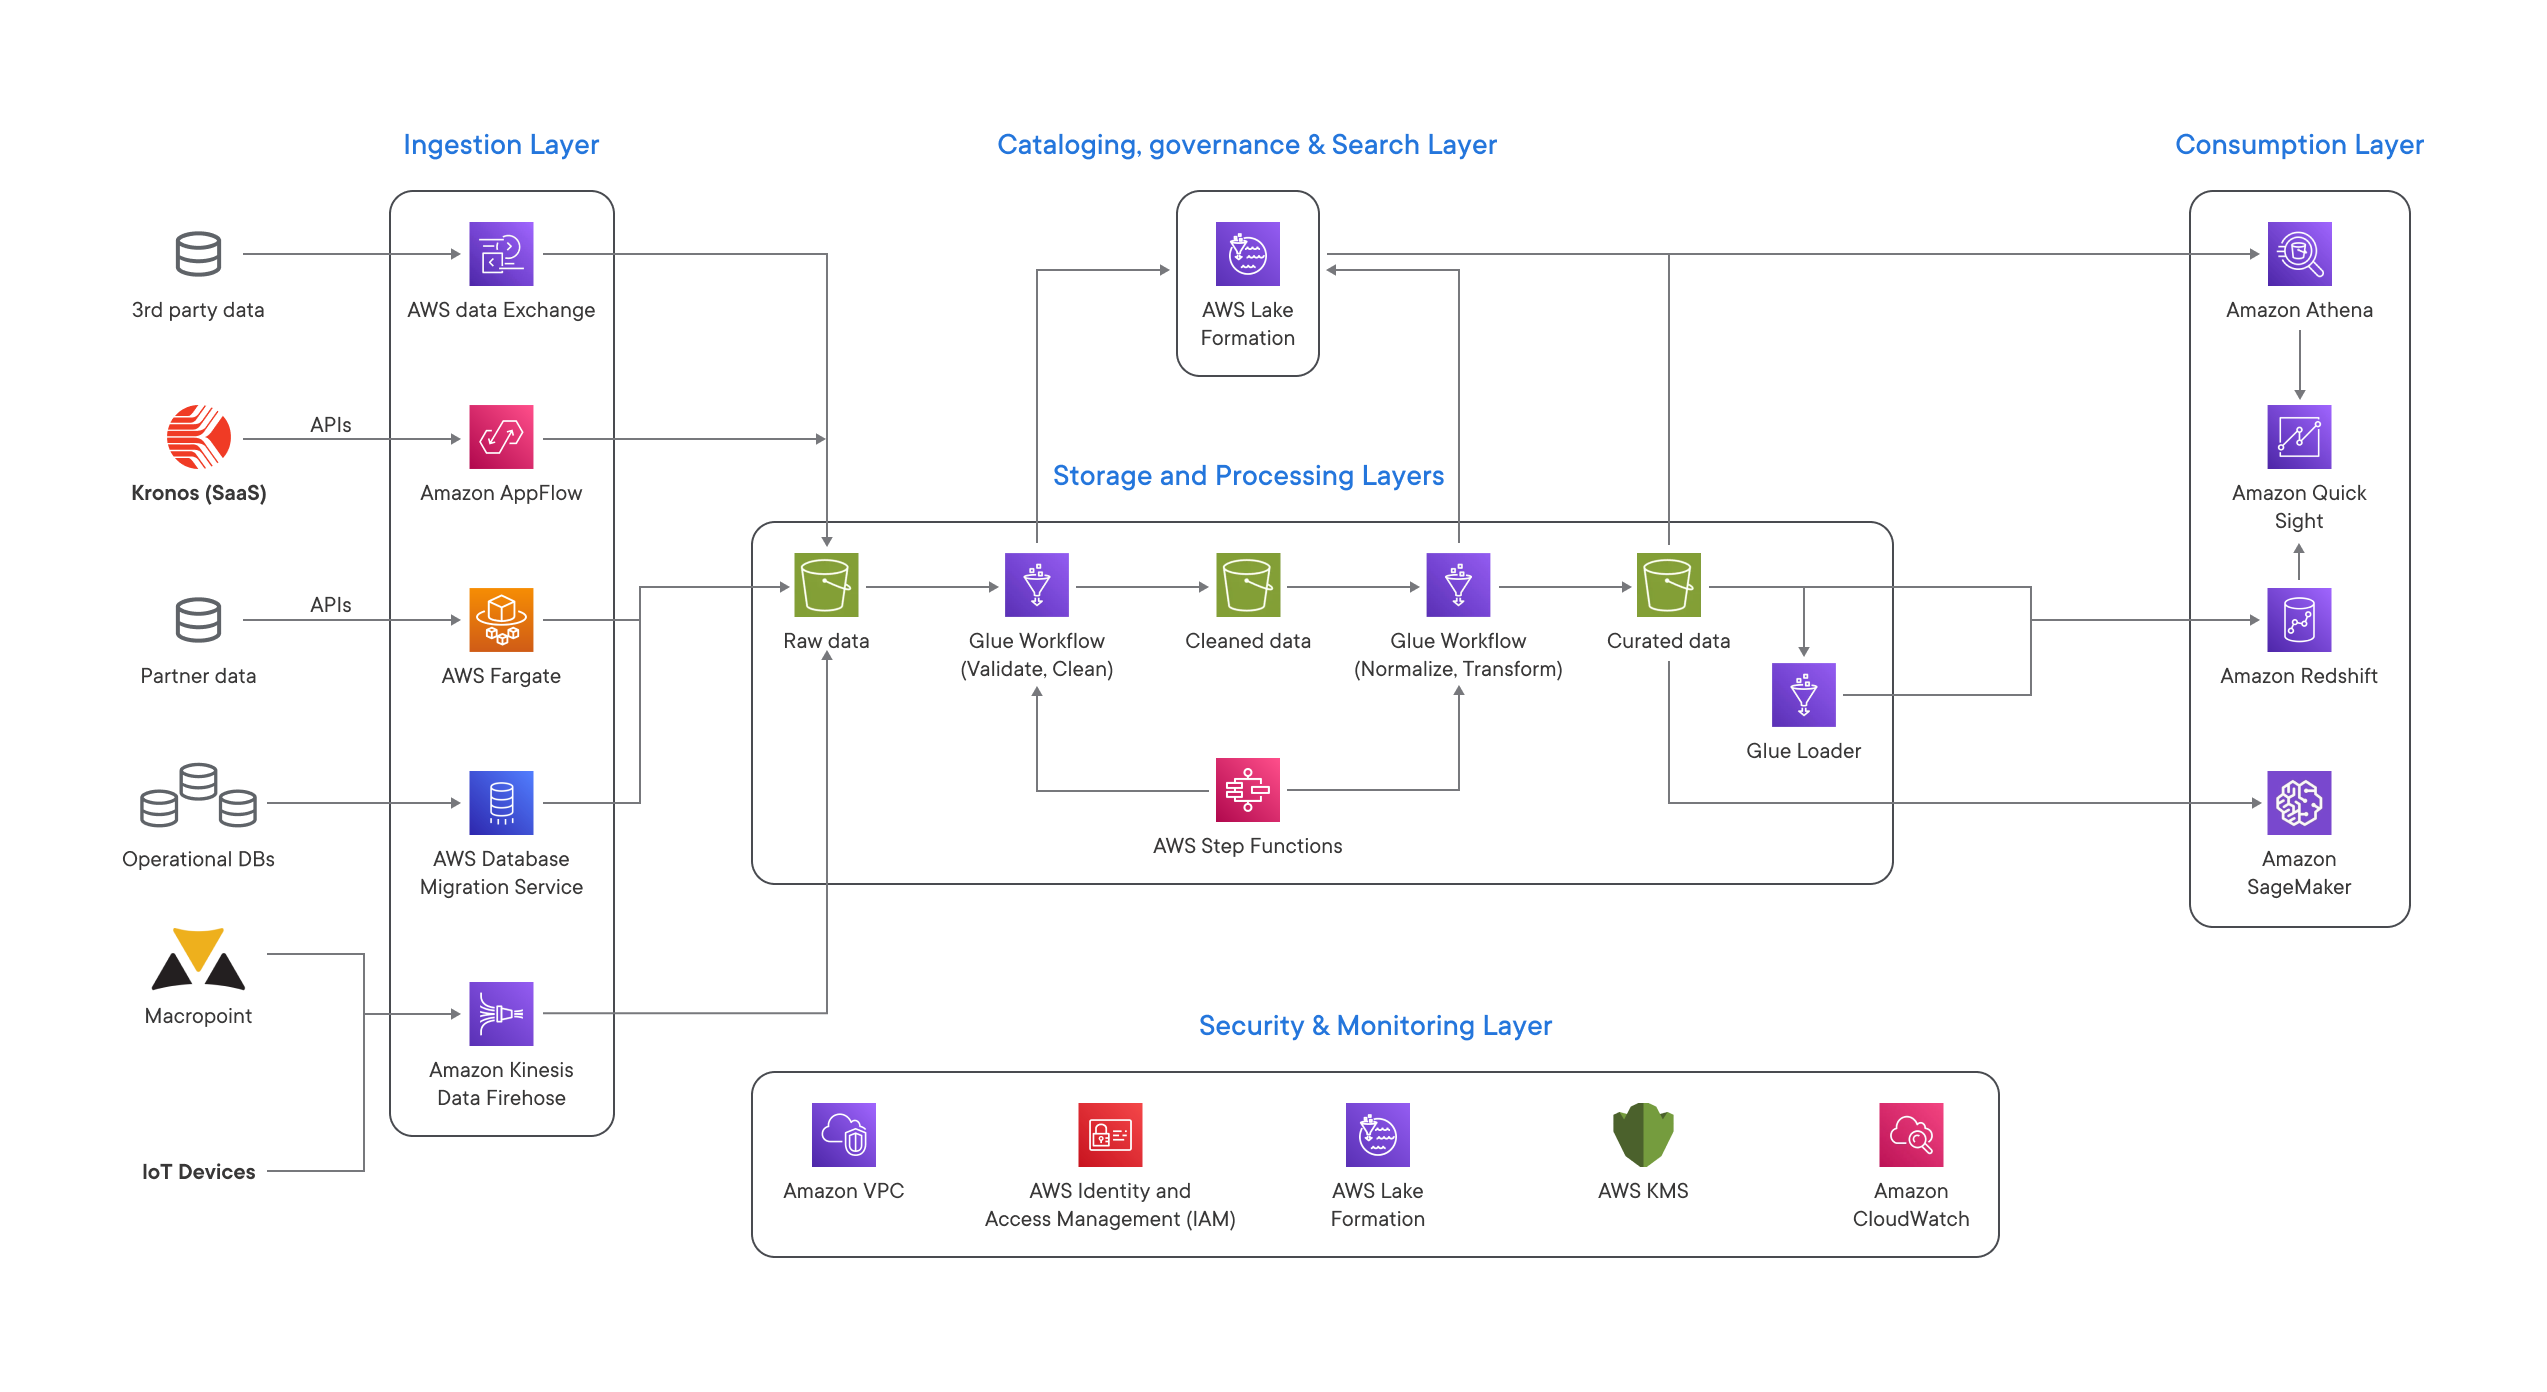
Designing a flexible solution architecture: 6 layers to organize distorted large-scale data
We composed a layered architecture to ensure separation of concerns, decoupling of tasks, and flexibility. The architecture consisted of six logical layers, described below in detail.

High-level architecture overview

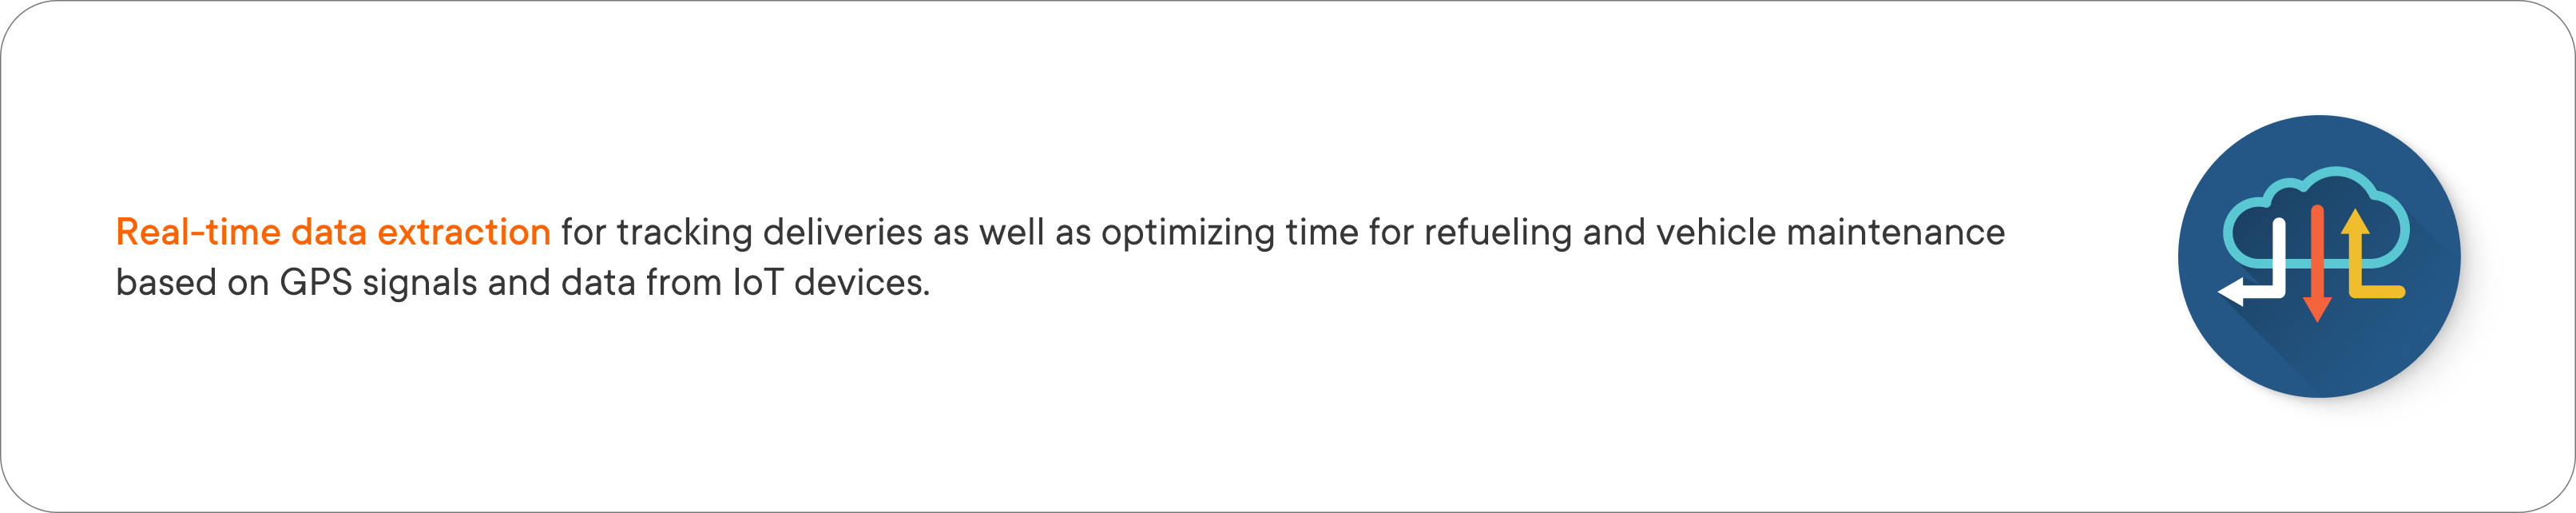
#1 Ingestion layer for smooth data aggregation
Responsible for extracting data from internal and external sources to the big data analytics system. It’s built on:
- AWS Data Exchange, which transfers data from third-party services into the system
- Kinesis Data Firehose, which handles loading data streams from IoT devices directly into AWS products for processing.
#2 Storage leyer to estimate data silos
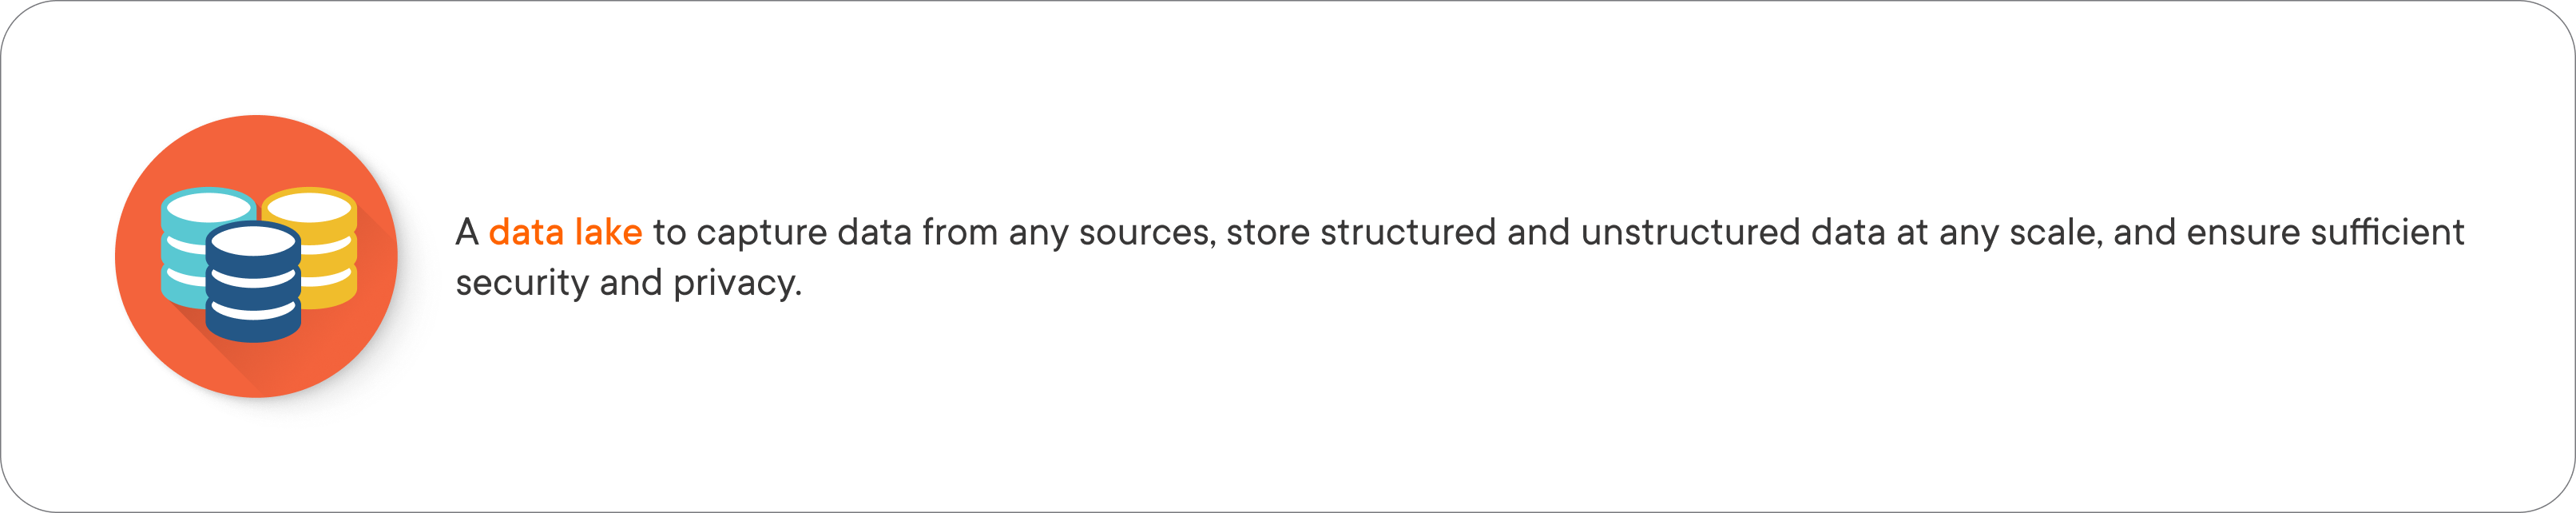
Stores structured and unstructured data for easy use in all other layers. We used Amazon S3 to provide unlimited and low-cost scalability for the client’s serverless data lake. The storage layer consists of three zones:
- Raw zone with data just received from the ingestion layer
- Cleaned zone with data after basic quality checks
- Curated zone with data ready for use in the consumption layer
#3 Cataloging and research layer for efficient dataset tracking
Has a central data catalog for managing and storing metadata for all datasets in the data lake through the AWS Lake Formation tool. AWS Glue, Amazon EMR, and Amazon Athena can natively integrate with Lake Formation and automate the process of discovering and registering dataset metadata in the Lake Formation catalog.
#4 Processing layer as a preparation for efficient data analysis
Makes data ready for consumption with the help of validation, cleanup, and normalization processes. We used AWS Glue to build and run ETL (extract, transform, load) jobs written in Python.
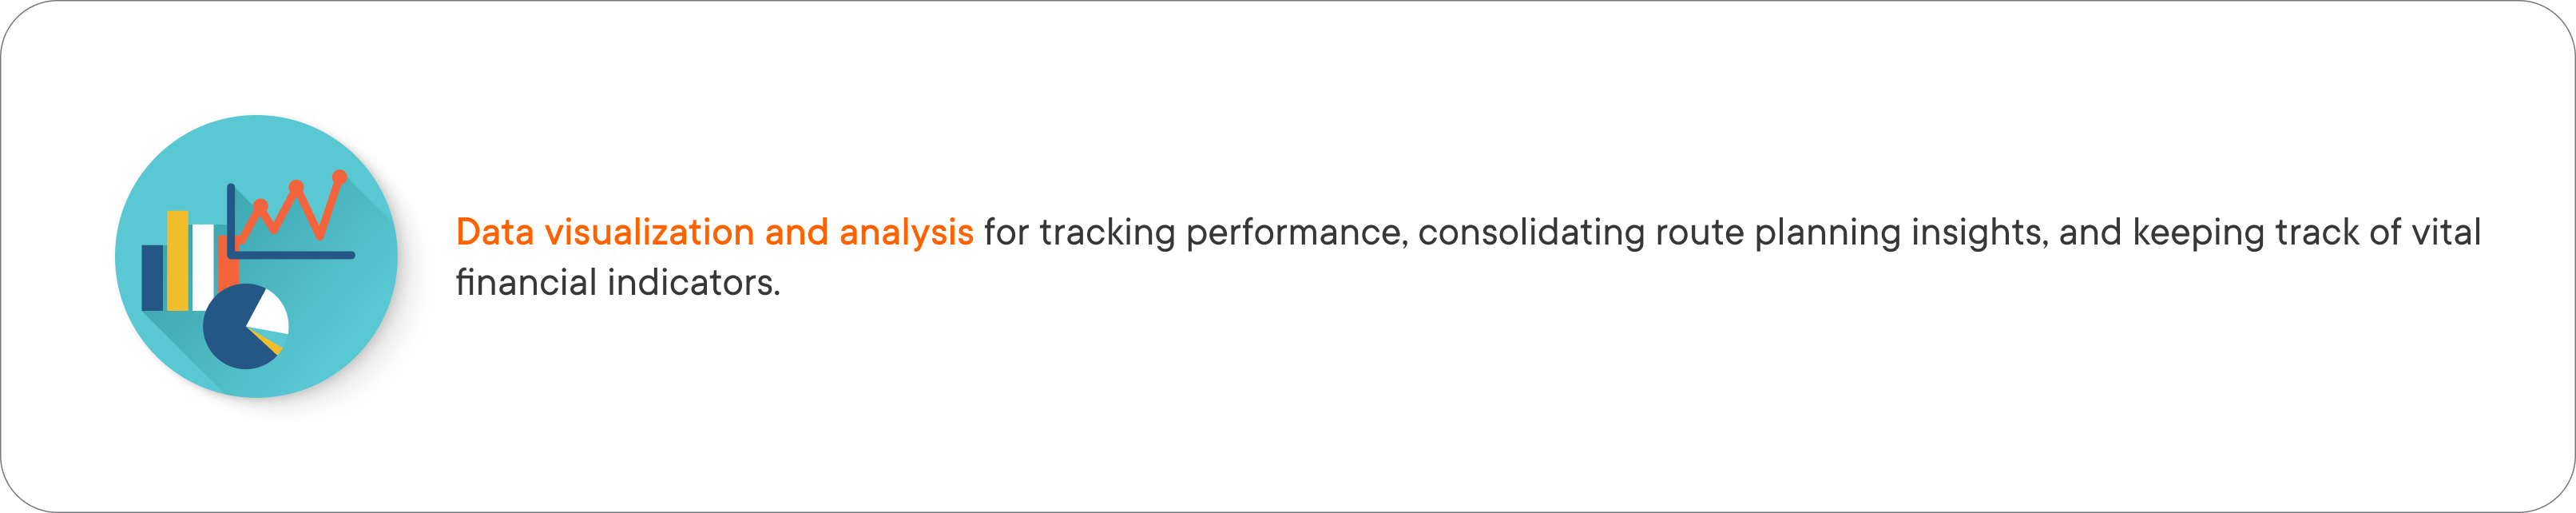
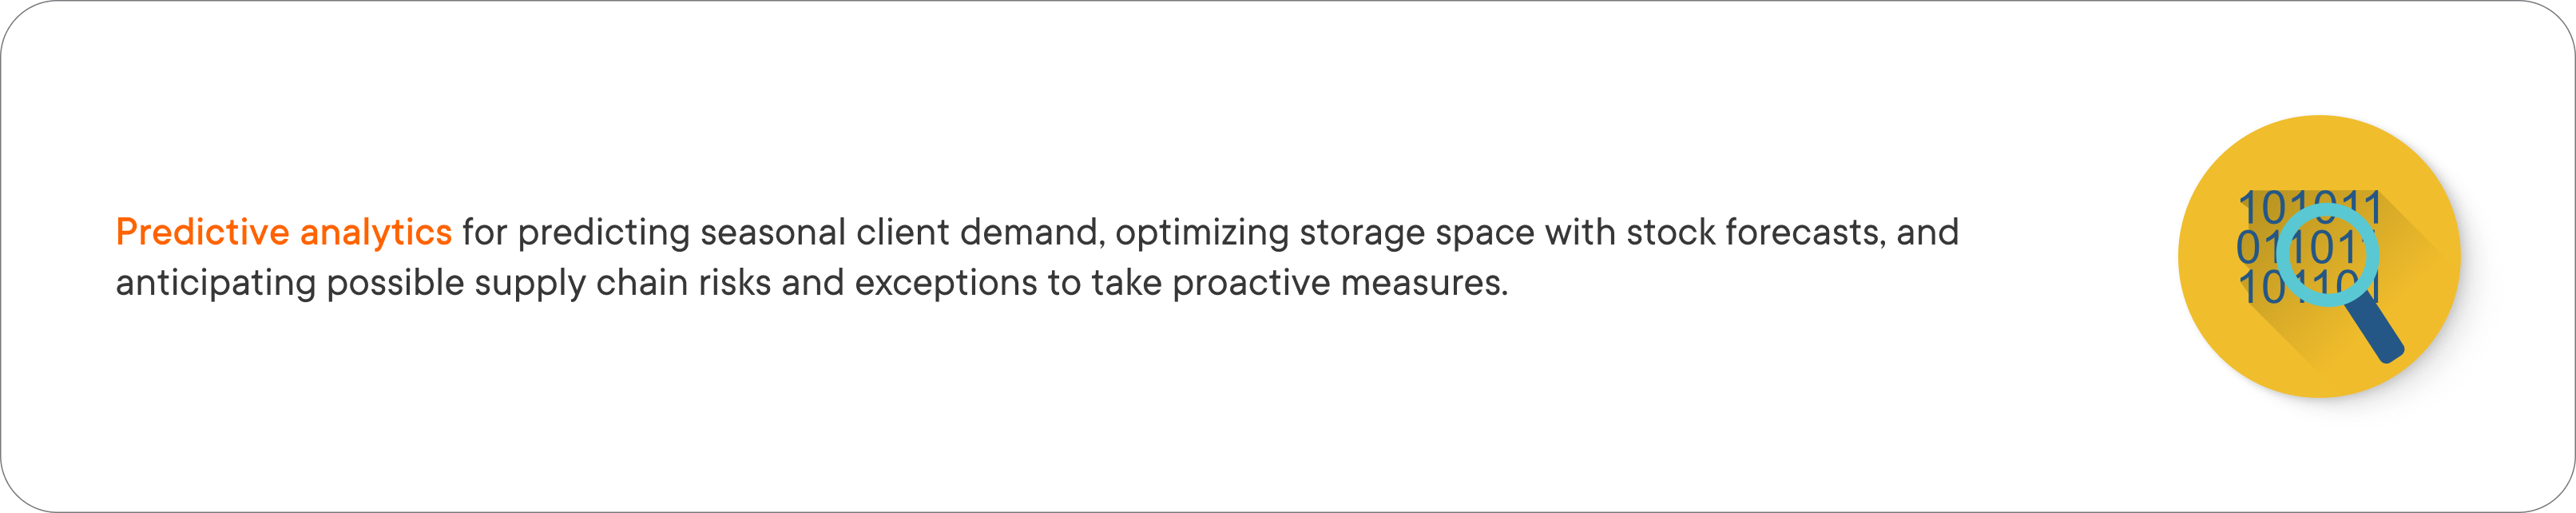
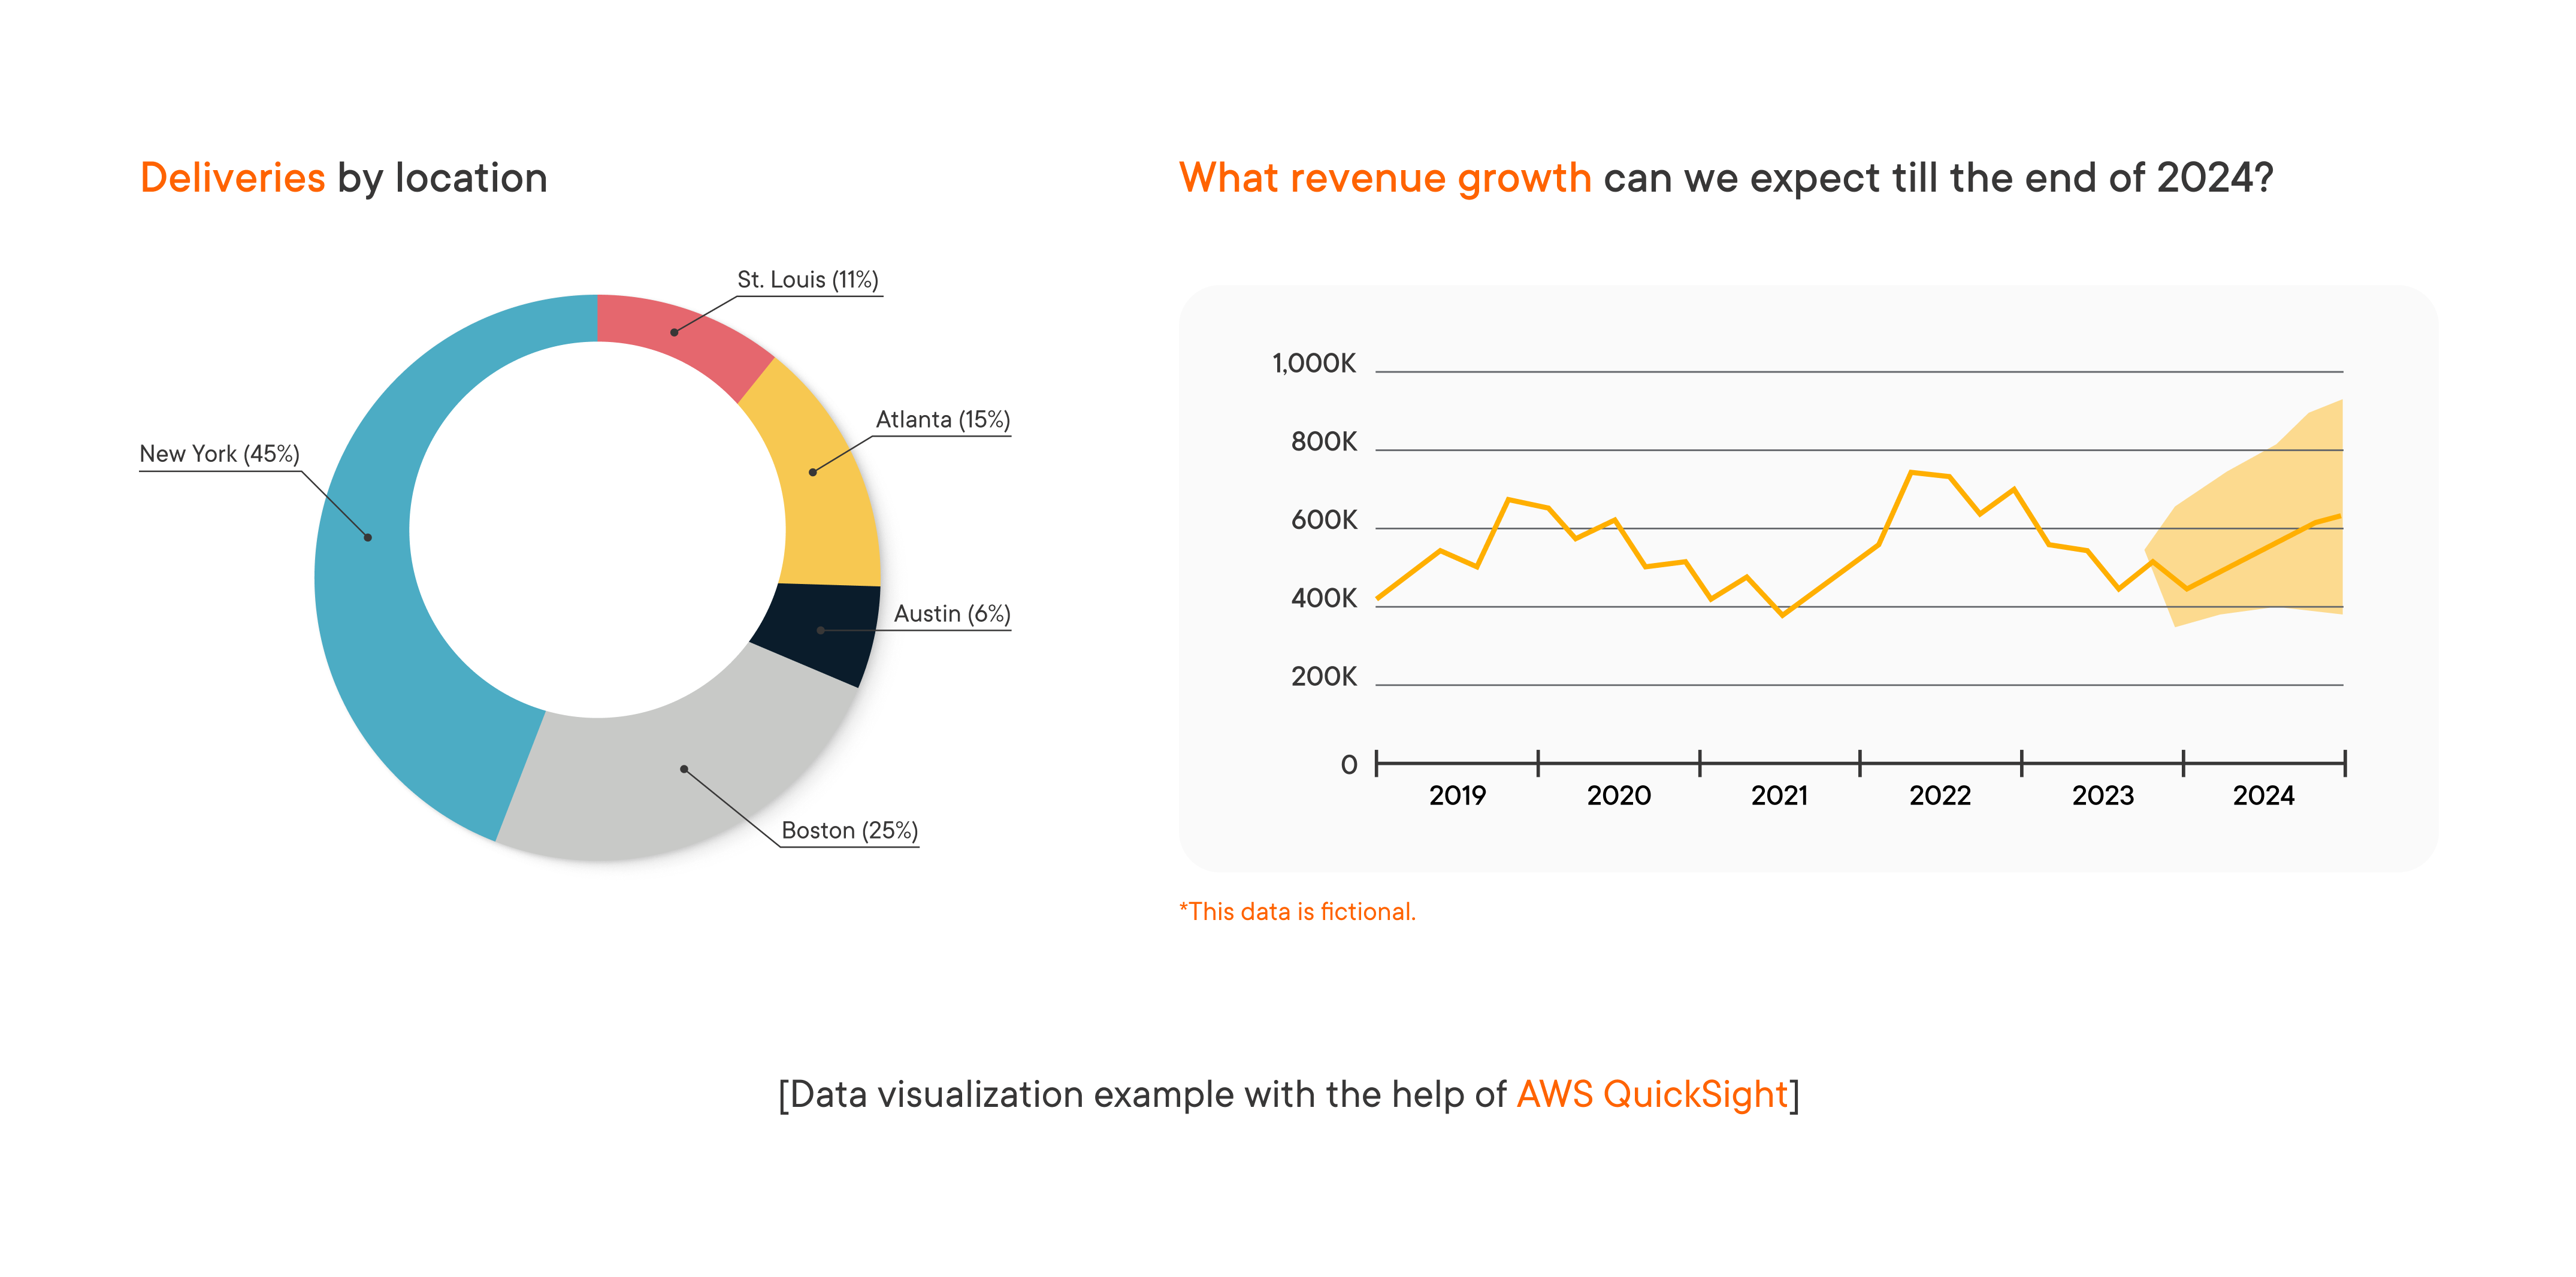
#5 Consumption layer to get valuable insights
Allows for data visualization, business intelligence (BI) analysis, and the use of ML algorithms. Amazon QuickSight provides a scalable and serverless BI service for data visualization, and Amazon SageMaker enables machine learning for predictive analytics on large-scale data.

#6 Security and governance layer to keep company and customer data safe
Protects data in all other layers. We ensured data security and governance with the help of Amazon Identity and Access Management, AWS Key Management Service, and Amazon Virtual Private Cloud.
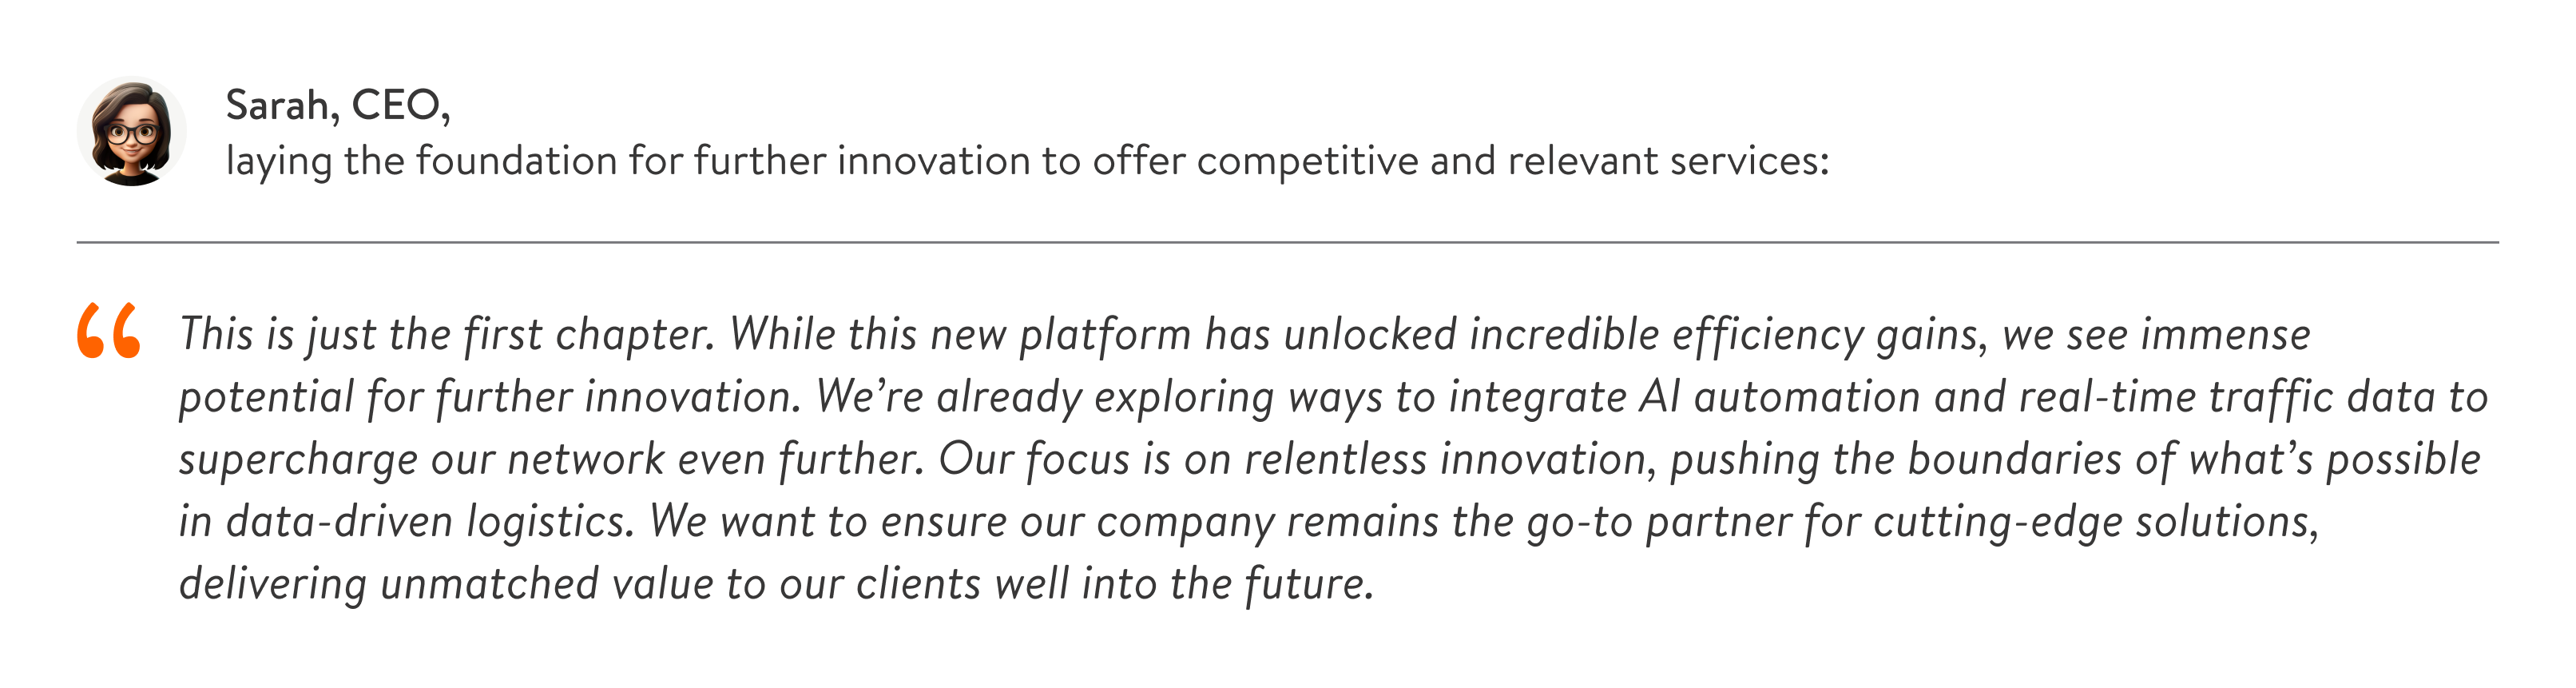
Future outlook
Unify your structured and unstructured data in a big data solution
Create a single source of truth and extract actionable insights to drive smarter business decisions.
More projects
-

Data lake for a manufacturing company
A data repository system for processing and storing massive amounts of production data
-
Load planning system
A solution for building feasible production plans by calculating the availability of materials
-
Smart logistics
A SaaS solution for transportation process optimization and automation


