
Data visualization services
-
Empower your departments with interactive operational dashboards that visualize key performance indicators (KPIs)
-
Support business decision-making and advance strategic planning by integrating data visualization tools
-
Analyze business insights from diverse perspectives with a variety of data visualization techniques
-
Increase the visibility of your internal business processes, efficiently identify bottlenecks, and improve operational workflows
Value we have delivered to our clients
-
Up to 50%
reduction in operating expenses
-
Up to 25%
increase in business process efficiency
-
Up to 30%
increase in customer satisfaction
-
Up to 20%
reduction in human error
Data visualization services Yalantis provides
Partner with Yalantis data specialists to enable data-driven decision-making and create a data core to justify future business initiatives by visualizing critical business processes and data assets.
-
Data cleaning and preparation
-
Select and assess available data assets that are necessary for data visualization
-
Clean data to ensure it’s consistent, includes all critical values, and is of high quality
-
Ingest datasets into data visualization tools in the right format
-
-
Dashboard development
-
Integrate data visualization tools
-
Customize data visualization techniques
-
Create interactive dashboards that correspond to specific business needs
-
Adjust dashboards to make them understandable for different stakeholders
-
-
Data analysis and interpretation
-
Establish clear interdependence between visualized KPIs and business goals
-
Evaluate dashboards’ clarity and business value
-
Develop training sessions and onboarding materials for end users
-
Turn complex data into visually appealing and actionable insights
Harness the power of data visualization with Yalantis to improve business planning and budgeting and to optimize workflows.
Yalantis: A data visualization company a proven portfolio
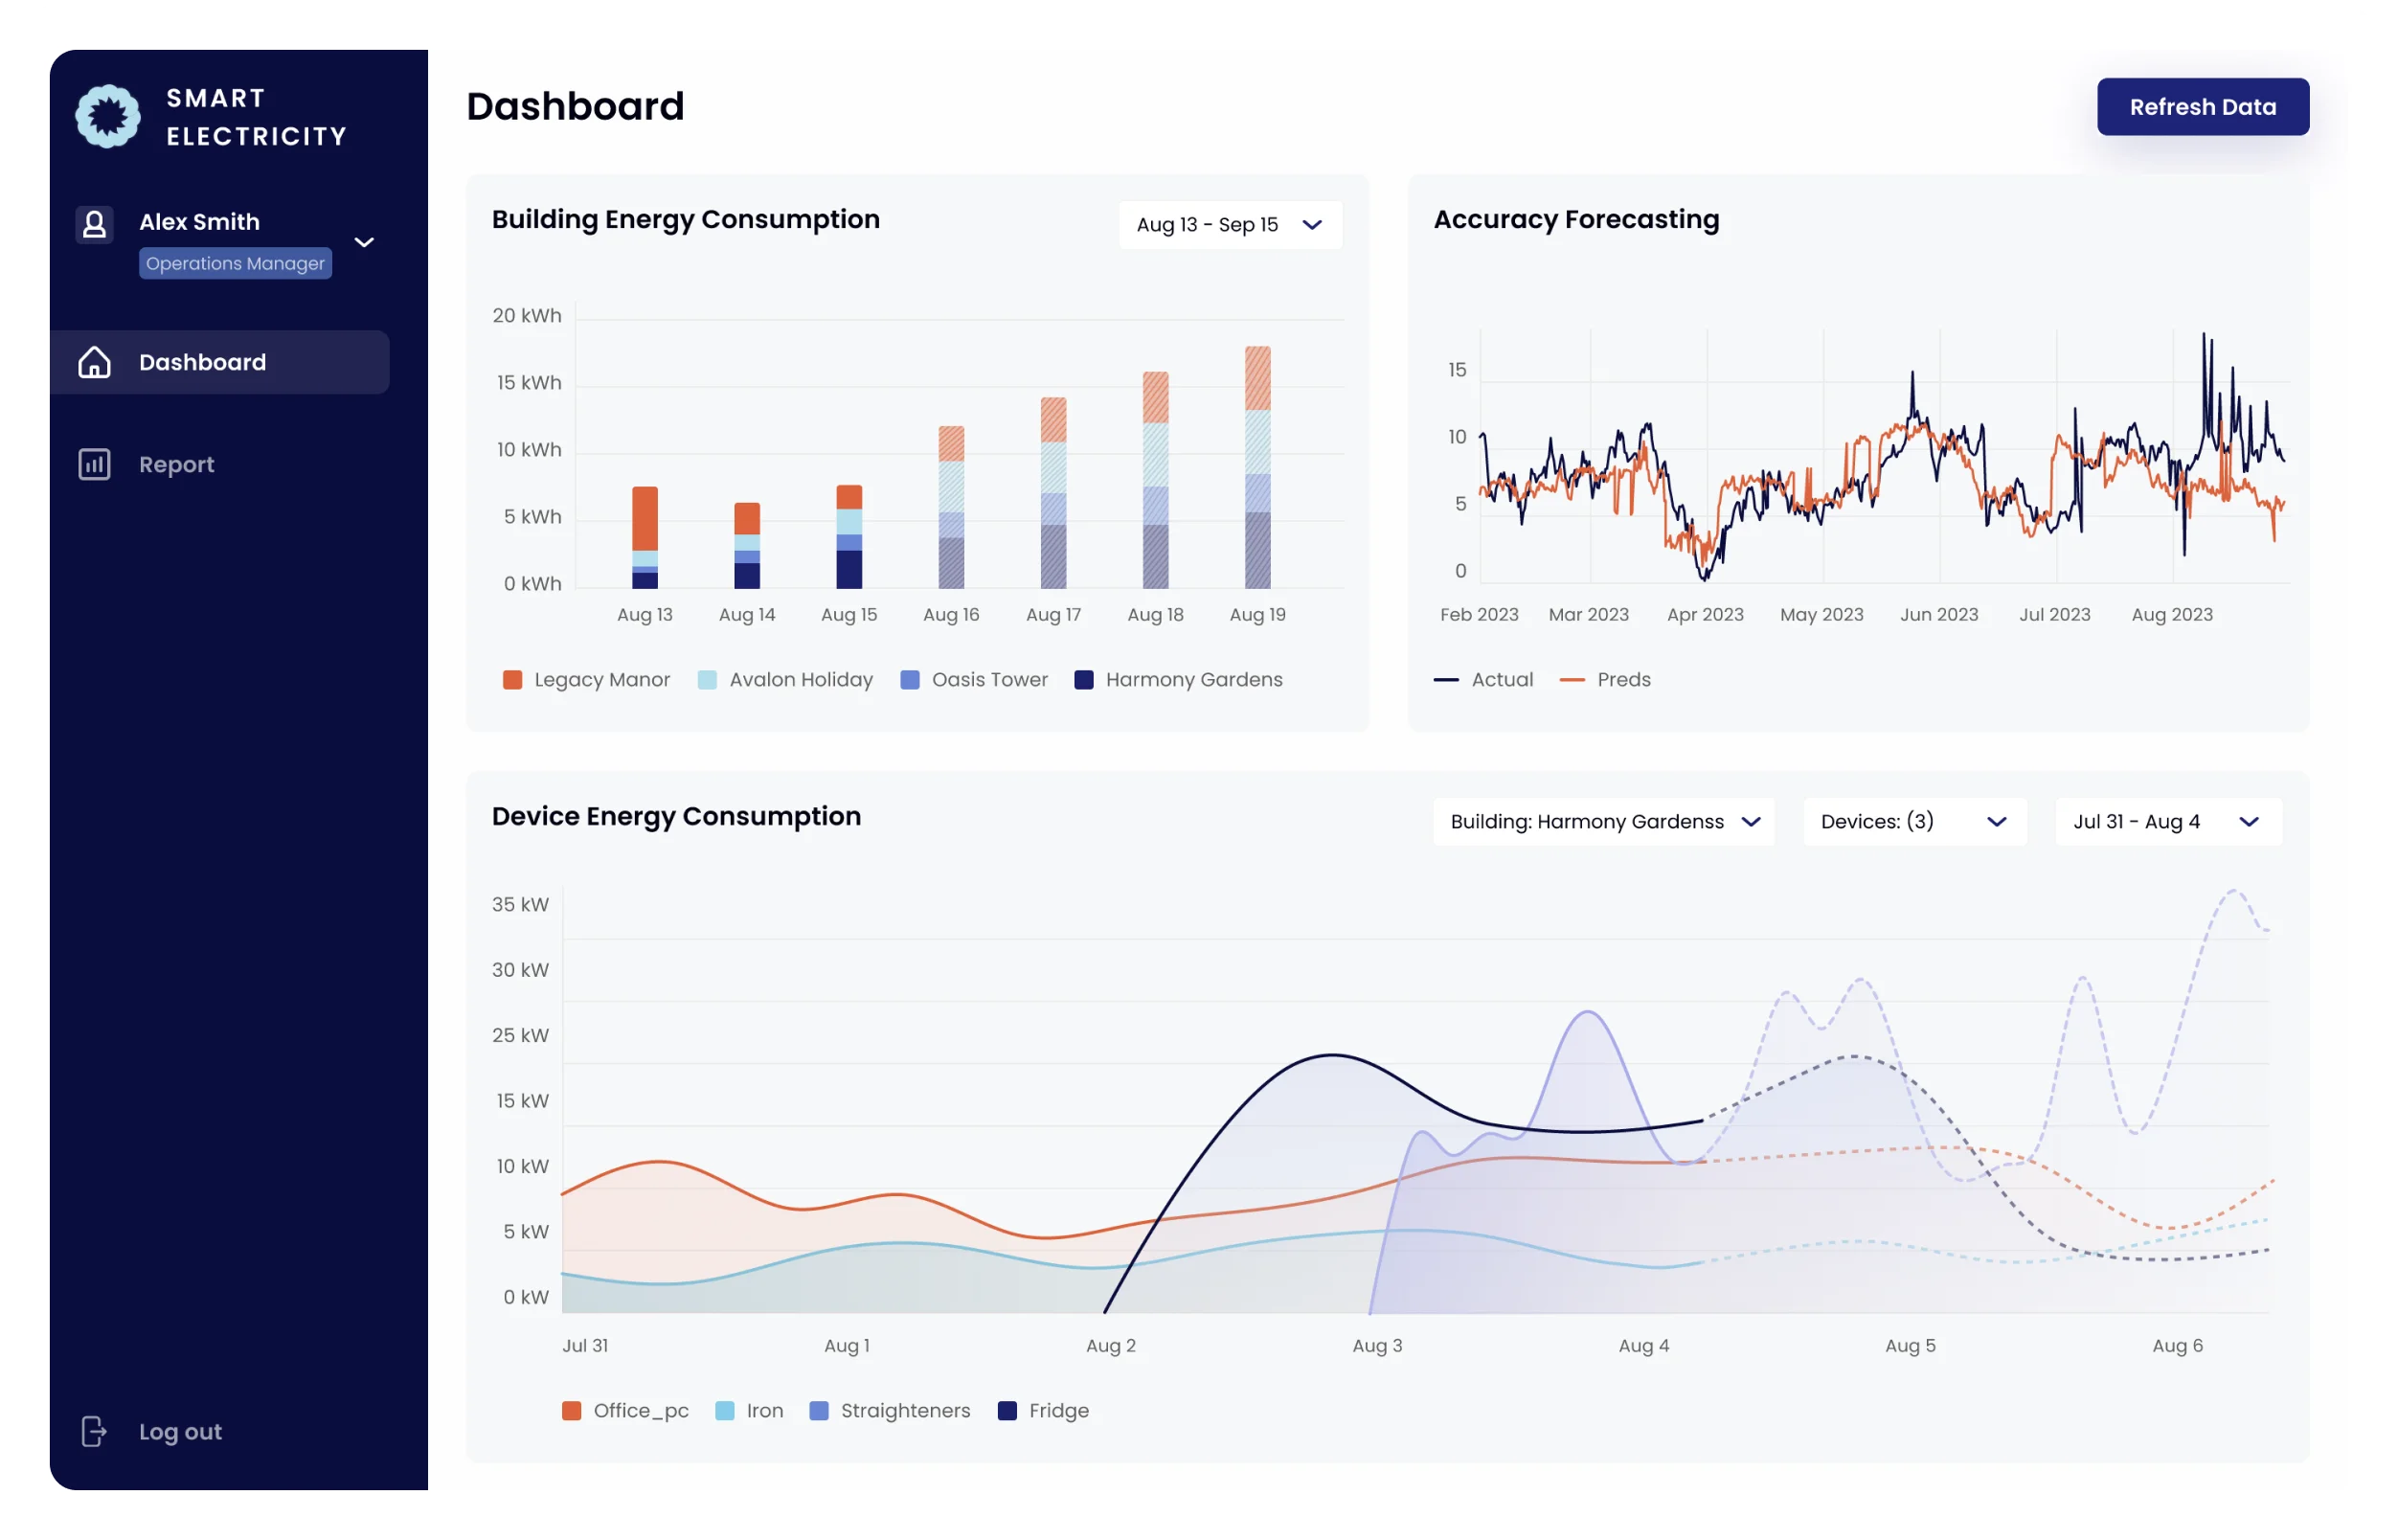


Diversify your business reporting process with data visualization techniques
Create interactive dashboards to elevate reporting sessions, increase the chances of stakeholder buy-in, and align cross-company goals.
Insights into Yalantis’ end-to-end data visualization services

Data lifecycle management (DLM): Key stages, tools, and compliance
Find out how to optimize business decision-making by implementing an insightful BI solution that involves fine-tuning your data lifecycle and establishing robust data management practices.
A Complete Guide to Data Modeling with Examples
Learn what data modeling is and why building accurate data models is important for software development success. Get to know why as a C-level executive you should participate in the data modeling process.

Business intelligence in healthcare: Benefits and the best tools
Learn why you need to implement a BI solution to analyze medical data and how it can improve your business operations. Also, get a list of the top five BI solutions worth considering.
FAQ
How do you customize your data visualization services?
To ensure a custom data visualization process, Yalantis data teams help you select and integrate data tools and technologies that align with your business goals, end users’ needs, and industry trends. In addition, our data visualization consulting team can help you identify goals and KPIs that are worth visualizing, taking into account your business model and workflow. Yalantis data experts can also create branded dashboards that you can use for reporting to investors or any external stakeholders
What data visualization techniques do you work with?
As a data visualization company, we can develop diverse data visualizations and tactical, operational, or strategic dashboards based on the level of decision-making you’re most interested in. Depending on your specific needs and the business metrics you need to measure, our data specialists can build branded line charts, bar charts, pie charts, heat maps, symbol maps, pivot tables, matrices, and any other custom dashboards you may need. We also advise you on the most suitable dashboard type for meeting your various business needs, such as dashboards with sales performance analysis, customer segmentation, or geographic distribution.
What are common data visualization challenges and how do you handle them?
Typical data visualization challenges that Yalantis data teams can handle include:
- dashboards overloaded with irrelevant and redundant data
- overcomplicated dashboards that aren’t insightful
- unmet end user needs and limited dashboard flexibility
Furthermore, our data experts excel in addressing issues related to data accuracy and consistency, tackling challenges such as unreliable data sources and inconsistent data formats. By implementing robust data validation processes and refining data pipelines, we ensure that visualized data is not only insightful but also trustworthy, empowering your decision-makers with valuable insights.
What options do you offer for expanding or modifying data visualizations as your clients’ needs evolve?
Options vary depending on how quickly and often your needs change. But as an experienced data visualization company, we always develop software solutions with scalability in mind. When it comes to such an ever-evolving technology niche as data visualization and data analysis — and given the increasing use of artificial intelligence — our data experts make sure to prepare your data infrastructure for frequent scaling and updating as well as to provide you with recommendations for hardware improvements if necessary. Plus, it’s critical to keep tabs on your data sources and datasets, as their quality and relevance are the most decisive factors for the success of your data visualization initiatives.
Data visualization as a service: Yalantis’ all-around data support
Yalantis’ data engineering and BI team provides lots of value-added data visualization service offerings, including data visualization as a service (DVaaS). It involves the following stages to provide you with an end-to-end data management and data analytics experience:
Fine-tuning data infrastructure
Before implementing any new data technologies, our experts assess your current data infrastructure to define your approaches to:
- data collection
- data security
- data storage
- data integration
- data analysis
We identify whether any of these processes need to be improved so that we can seamlessly and safely integrate data visualization tools.
Plus, Yalantis data specialists evaluate the quality, reliability, availability, and accessibility of data sources from which we need to collect raw data that we will then transform into a unified format to enable interactive visualizations. Our task at this stage also involves ensuring that your data infrastructure is scalable enough for future data analytics initiatives, such as deploying machine learning algorithms to enable predictive and prescriptive analytics.
Integrating best-in-class data visualization tools
Our BI specialists have experience integrating top-notch data visualization technologies that allow you to seamlessly visualize data without interruptions or performance issues. Tools we have integrated include Tableau, Amazon QuickSight, Power BI, and QlikView. We help you set up a convenient and customizable environment while working with any of these tools.
The major benefit of such tried and tested data visualization systems is that they’re regularly updated to meet changing software and hardware demands and offer improvements, both feature- and performance-wise. These tools also allow users to design intuitive dashboards with the help of templates and predefined settings (for example, automatically inserting frequently analyzed metrics into a dashboard).
Data analytics support
If your organization will be using a data visualization service for the first time, Yalantis data analysts can assist you with data analysis and dashboard interpretation. We can identify hidden patterns and correlations within different data dashboards to help you perceive visualized data as a whole and not only in the form of scattered unrelated dashboards. Thus, you can create a range of dashboards for your financial department and compare results to form a comprehensive perception of the department’s performance. On an even higher company-wide level, you can compare final results for each department and define overall business efficiency to efficiently monitor business processes and make informed strategic planning decisions.
All-around maintenance and management
The Yalantis team offers ongoing support to clients for whom we’ve set up a data visualization environment. If you lack maintenance and support resources in your in-house team, you can count on us. Our data specialists ensure your data visualization tools perform properly, deal with data security issues (IoT security services), and modify or update data technologies if you need to scale your data analytics capabilities (IoT data analytics).
As an advanced analytics solutions company, we conduct regular audits of your existing data solutions and help you handle bottlenecks that affect your business workflow and prevent you from making data-driven decisions.
Onboarding materials for end users
After implementing data visualization, you may face resistance among end users, especially if data visualization is new for them and they don’t see the value of creating dashboards. Yalantis data teams can prepare thorough documentation, interactive tutorials, and training materials to simplify the onboarding process for your end users.
We can also prepare detailed presentations for you to justify to internal or external stakeholders your decision to adopt data visualization at the company level. Such a presentation can list the values, benefits, and industry impact of adopting data visualization for your company, as well as meticulously calculated projections of what this decision will entail in your particular business case.
Choosing Yalantis’ data visualization services provides you with:
- scalable and reliable data infrastructure and data management practices
- cost-effective and secure implementation of the best-fit data visualization tool
- enhanced business decision-making with a smart dashboard interpretation approach
- stress- and hassle-free data analytics that constantly provides valuable and worthwhile insights
- a custom and simple approach to managing and analyzing complex datasets
- long-term partnership with a data team that stays at the cutting edge of data technologies and is eager to constantly share the newest trends with clients
Contact us

got it!
Keep an eye on your inbox. We’ll be in touch shortly
Meanwhile, you can explore our hottest case studies and read
client feedback on Clutch.


Lisa Panchenko
Senior Engagement Manager
Your steps with Yalantis
-
Schedule a call
-
We collect your requirements
-
We offer a solution
-
We succeed together!