Implementing BI for a radiology department
Learn how Yalantis helped a hospital strengthen decision-making, identify areas for improvement, and increase performance.
-
industry
Healthcare
-
Country
USA
-
Team size
5+
-
Implementation
6 months
About the client
Our client is a US-based hospital with a complex organizational structure and multiple clinical and business departments. Each department generates large amounts of data and manages it locally in data silos, preventing executives from getting a comprehensive overview of their business operations. As part of the hospital’s digital transformation of its core business processes, the company needed a software solution that could reveal issues in healthcare service delivery and save time and resources.

Business context
The client decided to implement a business intelligence (BI) approach to effortlessly observe data for enhancing business performance, optimizing the use of medical equipment, and improving patient outcomes starting with the radiology department. Here are the business goals the client wanted to achieve:
- Get insights into each radiologist’s performance to improve staffing decisions
- Detect issues with equipment overload or underload
- Measure patients’ satisfaction with radiological services
- Discern non-obvious correlations and patterns in the work of the department
- Define issues or bottlenecks that hinder the department’s workflow
Solution overview
-
Defining critical KPIs and data sources
We helped the client define critical KPIs and data sources to track and analyze.
KPIs included:
- The number and duration of radiological examinations (by equipment unit)
- The number of clinicians’ referrals to radiological examinations (by clinician)
- Radiology report turnaround time
- Patient volume in the radiology department
- Outpatient wait times per radiological examination (X-ray, CT, MRI, ultrasound)
Data sources included:
- Radiology Information System (RIS)
- Practice Management Software (PMS)
- Electronic Health Record (EHR) system
- Patient satisfaction surveys
Thanks to well-defined KPIs and data sources, we could help the client quickly spot and resolve unexpected business issues.
For example, if the report turnaround time increased but the number of examinations didn’t, hospital administrators could narrow down the probable issues to radiologists’ productivity/performance/qualifications or technological capabilities of report-generating software. But if the number of exams increased along with the report turnaround time, then most likely the issue would be the workload and an insufficient number of radiologists.
-
Setting up data infrastructure with a data warehouse and an ETL engine
For simplified data retrieval and analysis, our client needed to transfer data from relevant sources to a single storage location without data losses or corruption. To enable this, we had to set up seamless and secure data infrastructure with:
- an ETL engine as an ingestion layer for extracting and transforming data
- a data warehouse as a storage and processing layer
Steps we took:
- Building data models that allowed us to define relationships between key business entities (e.g. radiologists, clinicians, imaging modalities, patients, and examinations) to establish the proper data flow
- Developing a data warehouse star schema with fact and dimension tables that included detailed data on each business entity
- Configuring a data warehouse using the Apache Spark ETL engine and the Azure Synapse database for data warehouse storage
-
Ensuring insightful data visualization
Our solution architecture included a presentation layer for retrieving and displaying data for analysis with the help of the Tableau BI tool. It enables hospital staff to gain deeper insights into the efficiency of the radiology department. We customized the Tableau tool so that hospital staff could build only those dashboards, charts, and graphs that are relevant to their day-to-day needs. Drill-down and roll-up capabilities of the tool enable the client to define the level of analytical detail needed during a particular analysis.
Providing training materials for hospital staff
Our team prepared documentation and training materials for hospital staff to learn how to effectively use the new BI tool and generate insights. We also conducted training presentations explaining how to interpret and make sense of data. Plus, our BI experts provided support services whenever the client needed additional consultation on use or maintenance of the BI solution.
Value delivered
The BI solution helped our client unify disparate clinical and patient data for effective decision-making. By generating insights, the client could quickly act upon them and was able to:
-
decrease outpatient wait times by 20 percent
-
optimize radiologists’ productivity and reduce labor costs by 10 percent
-
optimize the use of imaging modalities by monitoring the length of examinations
-
re-evaluate referrals to the radiology department and define trends and patterns
-
increase patient satisfaction due to decreased waiting times and quick radiology report generation
Increase your clinical data visibility with a custom BI solution
Generate deep insights about your clinical workflow, detect anomalies and trends to improve patient outcomes, and reduce operational expenses
More projects
-

IT consulting for a mental health company
Business and design consulting for integrating a practice management system with an EHR system
-
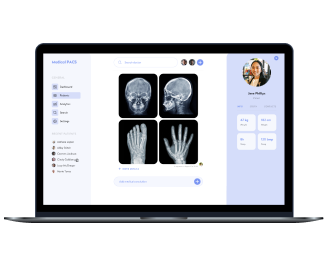
Medical PACS
IT consulting and optimized organizational and technical processes for a PACS company
-
Integration with EHR systems
A patient portal and practice management system integrated with the most popular EHR systems