


The modern app market dictates high requirements for the user experience and overall app performance. Your app should load fast, work seamlessly, and not crash. But no one can guarantee 100% protection from unexpected events.
To find the root cause of bad performance or crashes and find possible ways to optimize your app, you should constantly monitor its performance. In this article, we tell you what you should measure and which tools will help you with this.
The importance of performance testing for web applications
Application performance monitoring (APM) ensures your app works as expected. It’s generally enabled via specialized software integrated into the app.
There are two main aims of app performance monitoring:
- Get data on app performance. APM tools constantly monitor an application and gather data on its performance, which is then converted to graphs and reports. Getting regular insights on how your app works in a real-life environment can help you identify ways to optimize performance.
- Get timely alerts on unusual behavior. APM software analyzes data over the long term and alerts administrators about non-deterministic behavior like memory leaks, CPU utilization spikes, and even hacker attacks. It also can signal a lack of resources so you can alert DevOps engineers of the need to scale in a timely manner.
What does APM mean for your business?
- Enhanced user experience. In a market flooded with applications for different needs, users are extremely demanding when it comes to app performance. A Google survey in 2018 showed that 53 percent of mobile users leave a web app that takes longer than three seconds to load. So as not to lose potential customers, you need to optimize your application. APM metrics will help you define the causes of bad performance and eliminate them.
- Improve business continuity. Ongoing Go performance testing allows you to make upgrades and changes to your application infrastructure safely and troubleshoot your app more easily. Combined with analytics tools, APM provides broad insights that allow developers to effectively predict crashes and prevent downtime.
- Quickly prevent losses. No app is immune from downtime and attacks. Disruption in business performance equals lost revenue, regulatory fines, damage to brand reputation, and loss of customer loyalty. APM tools can quickly notify you about app downtime so you can quickly normalize the situation.
TICK stack for collecting general measurements
The TICK stack is a common tech stack for monitoring app performance. It consists of four free open-source tools: Telegraf, InfluxDB, Chronograph, and Kapacitor. Let’s take a closer look at each tool.

Telegraf
Telegraf is a free plugin-driven server agent written in Go. It collects long-term data about app performance and behavior and sends this data to a chosen database. By default, Telegraf sends information to InfluxDB, but it can also connect to other datastores including Redis, MongoDB, and MySQL.
Telegraf is compiled into a single binary with no external dependencies. It’s lightweight and requires a minimal memory footprint. Telegraf has plugins that collect metrics directly from the system it’s running on, pull metrics from third-party APIs, and even listen for metrics via services like Kafka and statsd.
InfluxDB
InfluxDB is a time-series database (TSDB) optimized for time-stamped data. Time-stamped or time-series data are measurements that are tracked, monitored, downsampled, and aggregated over time. Under this category fall application performance monitoring data, network data, server metrics, and other types of analytics data. InfluxDB supports multiple fields and can work with many data types.
This is an easy-to-use and fast solution that deals with large data sets. No additional programming is required when implementing InfluxDB in products. But bear in mind that the open-source version of InfluxDB lacks security. Developers should either add their own security mechanisms or purchase the enterprise version.
Chronograf
Chronograf summarizes and visualizes all received data. It’s an administrative component of the TICK stack that provides developers with an intuitive and understandable interface.
This tool has a set of templates and libraries that allow developers to quickly create custom dashboards and generate rules for system alerts.
Its functionality can formally be divided into five parts:
- Data visualization – Provides a wide range of precreated dashboards that you can easily customize
- Alert management – Create, enable, or disable alert rules, view active alerts on the dashboard, and send alerts to Slack, Telegram, HipChat, Kafka, Pushover, and many other services
- Multi-user support – Provide and restrict access to dashboards and allow users to set up and maintain unique dashboards for their organizations
- Database management – Create and delete databases and retention policies, view currently running queries, and stop inefficient queries from overloading your system
- Infrastructure monitoring – View all hosts and applications configured on each host
Kapacitor
Kapacitor is a data processing engine able to process both stream and batch data. You can use it to query data from InfluxDB on a schedule and receive it via the line protocol and other methods InfluxDB supports. Also, Kapacitor performs data transformations and returns transformed data to InfluxDB.
When using TICK stack, we store statistics in InfluxDB and utilize influxdb1-client as a client to deliver this data to InfluxDB.
Alternative solutions
Besides the TICK stack, there are several tools that have proved reliable for ongoing app performance monitoring.
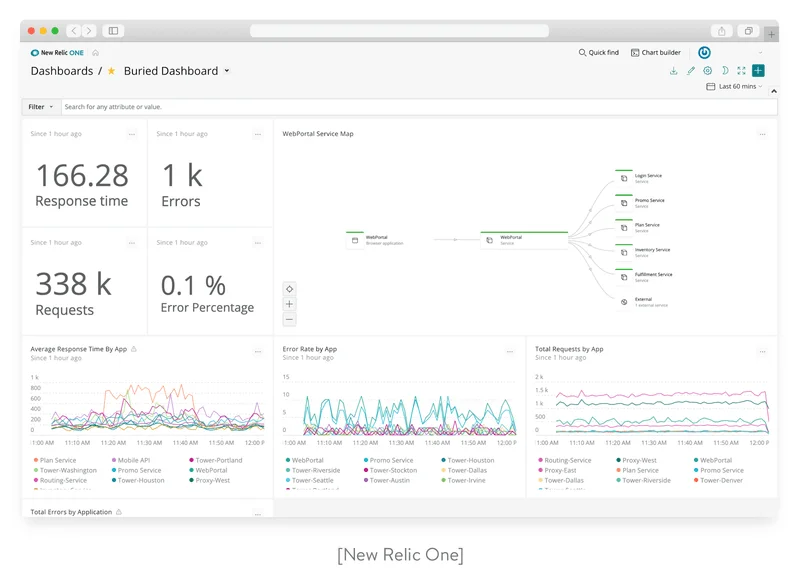
New Relic
New Relic is an exceptionally customizable tool that offers many types of visualizations (graphs, histograms, maps, etc.) to help you understand what affects your app’s performance. Thanks to alerting functionality, you’ll be notified immediately in case of non-deterministic app behavior. New Relic collects data into detailed reports that give deep insights about your app’s performance.
This tool offers integration with more than 200 popular databases and development tools, including Elasticsearch, AWS, StatsD, Apache, and NGINX, and others. It also offers Android and iOS apps, so you can monitor your app performance on the go.
Keep in mind that New Relic isn’t the free product; the price varies according to the functionality you need. The abundance of options and configurations sometimes makes it difficult to figure out what exactly causes bad performance. It may also take time to onboard new developers when working with New Relic.
There’s no on-premise solution for New Relic, which means you can’t restrict access to statistics. This may be a sticking point for organizations that have strict policies regarding access to data.
The New Relic Go Agent enables developers to monitor their Golang applications using New Relic.
Prometheus
Prometheus is an open-source monitoring tool created by SoundCloud. It has a multi-dimensional data model with time-series data identified by metric name and key/value pairs.
This tool consists of several optional components:
- Prometheus server is the main part of Prometheus; it collects and stores time-series data.
- Prometheus Query Language (known as PromQL) is a powerful and flexible query language that lets you easily select and aggregate time-series data in real time.
- AlertManager handles all alerts sent by Prometheus. All alert rules are set in Prometheus server, while AlertManager takes care of deduplicating, grouping, and routing alerts to the correct receiver integrations (chat platforms, notification systems, etc.).
- Pushgateway is a so-called metrics cache that allows ephemeral and batch jobs to expose their metrics to Prometheus. Since these kinds of jobs may not exist long enough to be scraped, they can instead push their metrics to a Pushgateway. The Pushgateway then exposes these metrics to Prometheus.
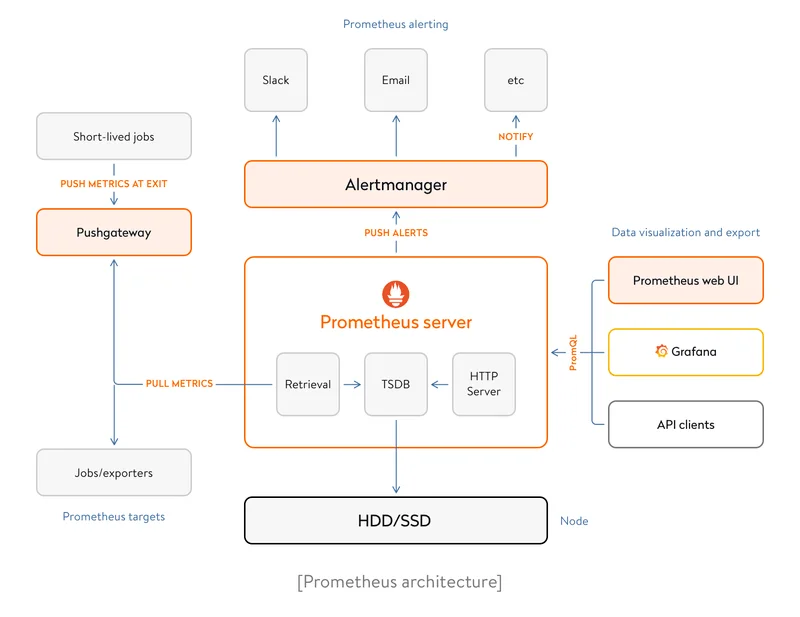
Most Prometheus components are written in Go, making them easy to build and deploy as static binaries. Prometheus is easily integrated with a large list of databases and exporters.
But bear in mind that Prometheus is not a dashboarding solution; it has a simple UI. If you’re seeking visualizations and dashboarding, you can use Prometheus together with Grafana, but that makes setup more complex. Also, Prometheus has no option for long-term storage, which can be critical for complex applications.
The Prometheus Go Client allows you to monitor your Go app with Prometheus. It consists of two parts: one for instrumenting application code, another for creating clients that talk to the Prometheus HTTP API.
NetData
NetData is another free open-source performance benchmark that has a pleasant and user-friendly design.
This tool provides real-time insights into everything happening on the systems on which it runs (including web servers, databases, and applications) using highly interactive web dashboards.
NetData can run autonomously, without any third-party components, or it can be integrated into existing monitoring tool chains (Graphite, OpenTSDB, Kafka, etc.).
It monitors and analyzes lots of metrics, allowing you to get the fullest and deepest insights into your app’s performance. Currently, NetData is under active development, with frequent updates and bug fixes.
But NetData’s focus on real-time metrics makes this not the best solution for analyzing historical incidents. NetData is good for tracking stats over the last few hours and allows you to avoid CLI tools in order to diagnose an outage. But it doesn’t support lowering the resolution of older statistics. Configuring NetData to store historical data in per-second resolution requires a lot of memory, so it’s not the best option.
Also, NetData is only accessible via a web browser.

Go-runtime-metrics
The small open-source go-runtime-metrics library collects and visualizes statistics solely about the Golang app runtime. Besides metrics, this library collects the following data:
- Alloc and HeapAlloc – bytes of allocated heap objects
- TotalAlloc – the sum of bytes allocated for heap objects (In contrast with Alloc and HeapAlloc, TotalAlloc doesn’t decrease when objects are freed)
- Sys – the total bytes of memory obtained from the operating system
- Mallocs – the number of mallocs
- Frees – the sum of all heap objects freed
- HeapSys – the bytes of heap memory obtained from the operating system
- HeapObjects – the number of allocated heap objects
- NextGC – the target heap size of the next garbage collector’s cycle (At the end of each GC cycle, the target for the next cycle is computed based on the amount of reachable data and the value of GOGC)
These metrics can also be recorded by MemStats in the runtime package.

Statsd
Statsd is a network daemon that aggregates app performance statistics (i.e. counters and timers sent over UDP or TCP) and sends them to one or more pluggable backend services (e.g. Graphite).
Example of how to analyze the performance
Let’s imagine we have an HTTP service that counts characters in incoming requests. We’re going to deploy it to a production server. Fortunately, before the release, we conducted app performance monitoring.
With the first wave of traffic (of which we’re alerted by the system), we realize this simple service consumes too many resources.

To investigate the reason for such behavior, we profile the service in the local environment using the pkg/profile package.
To do so, we start the profiler on top of the main function:
defer profile.Start(profile.MemProfileRate(1), profile.ProfilePath(".")).Stop()
profile.MemProfileRate(1)` configure profiler to collect information about each allocation.
Then we created the following step-by-step testing strategy:
1. Start the service.
2. Make a single request containing 5MB of text.
3. Stop the service.
A file with the name mem.pprof appears. We start analyzing it with the command go tool pprof mem.pprof.
Then we run the command top main. top is a command, and we use main to filter by the name of the file we’re interested in and to exclude vendor libraries.
Active filters:
   focus=main
Showing nodes accounting for 6MB, 97.61% of 6.15MB total:
Dropped 51 nodes (cum <= 0.03MB)
      flat  flat%   sum%        cum   cum%
       6MB 97.61% 97.61%        6MB 97.61%  bytes.makeSlice
         0     0% 97.61%        6MB 97.61%  bytes.(*Buffer).ReadFrom
         0     0% 97.61%        6MB 97.61%  bytes.(*Buffer).grow
         0     0% 97.61%        6MB 97.61%  io/ioutil.ReadAll
         0     0% 97.61%        6MB 97.61%  io/ioutil.readAll
         0     0% 97.61%        6MB 97.61%  main.main.func1
         0     0% 97.61%        6MB 97.61%  net/http.(*ServeMux).ServeHTTP
         0     0% 97.61%        6MB 97.61%  net/http.(*conn).serve
         0     0% 97.61%        6MB 97.61%  net/http.HandlerFunc.ServeHTTP
         0     0% 97.61%        6MB 97.61%  net/http.serverHandler.ServeHTTP
As you can see, bytes.makeSlice is the method that produces allocation. Walking down the call trace/hierarchy, we see the source (file, function) where the main.main.func1 caller is placed.
Now we run the command list main.main.func1 in the previously launched pprof to see the allocation per line.
Total: 6.15MB
ROUTINE ======================== main.main.func1 in /Users/user/go/src/article/main.go
         0        6MB (flat, cum) 97.61% of Total
         .          .     30:
         .          .     31:func main() {
         .          .     32:    defer profile.Start(profile.MemProfileRate(1), profile.ProfilePath(".")).Stop()
         .          .     33:
         .          .     34:    http.HandleFunc("/", func(w http.ResponseWriter, r *http.Request) {
         .   6MB     35:        bb, _ := ioutil.ReadAll(r.Body)
         .          .     36:        rbody := bytes.NewReader(bb)
         .          .     37:        n, _ := countLetters(rbody)
         .          .     38:        _, _ = fmt.Fprint(w, n)
         .          .     39:    })
         .          .     40:
Line 35 is where bad performance allocation happens due to reading the whole body of requests. Our service counts characters, and doesn’t need to have the whole text to do so. This means that we need only some of the requests to do the job.
We replace lines 35 and 36 with rbody := bufio.NewReader(bb). The bufio package provides us with Reader, which includes buffering. It will also optimize performance if the function countLetters uses a smaller buffer than bufio.NewReader.
Here is the full handler code:
http.HandleFunc("/", func(w http.ResponseWriter, r *http.Request) {
    rbody := bufio.NewReader(r.Body)
    n, _ := countLetters(rbody)
    _, _ = fmt.Fprint(w, n)
})
Our refactored code saves a lot of traffic. The spikes on the graph show the work of the garbage collector:
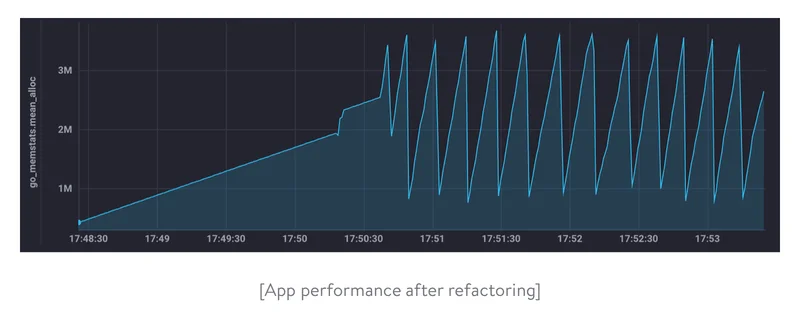
Thanks to synthetic testing, we’ve quickly found a performance issue in production, fixed the code that caused this issue, and ensured the application consumed far fewer resources. Of course, in real life, any application should be tested before release (using performance tests) to avoid potential performance issues.
As you can see, application performance monitoring is very important and must be done on a regular basis. Different performance management solutions are available to make this process more efficient. Today’s world is dependent on apps, so application performance monitoring is critical for your business’s success.
Want to create beautiful web software?
Here’s how we can help you
About the author