



Your business generates valuable business intelligence every day. Take advantage of it and see the full picture. Transform raw business data into powerful visual stories with compelling data visualizations that reveal patterns and opportunities, identify trends, and make smarter decisions faster. It’s all possible with our data visualization consulting services.
Data Visualization Services


17+
Years
of experience
150+
Specilists
ISO
Certified
AWS
Partner
Network
ISTQB
Certified tester
Foundation level
Our Clients








Data visualization services by Yalantis

Data cleaning and preparation
- Assessment and selection of relevant data assets for visualization
- Data cleansing to ensure its consistency, completeness, and quality
- Formatting and ingestion of datasets into visualization tools with proper structure
- Smooth data integration from multiple sources, including data platforms already in use

Dashboard development
- Integrating data visualization tools picked for you specifically
- Customizing visualization techniques to maximize data comprehension
- Creating interactive dashboards aligned with your business needs and objectives
- Adjusting dashboards to make them understandable for different business users

Data analysis and interpretation
- Establishing clear connections between visualized KPIs and business goals
- Evaluating dashboard clarity, effectiveness, and business value
- Developing comprehensive training materials and onboarding resources

Data modeling
- Designing optimized data structures for efficient visualization workflows
- Creating dimensional models for multi-perspective data exploration
- Implementing relationship mapping to reveal connections between datasets
- Developing calculation frameworks for derived metrics and complex KPIs

Data lifecycle management
- Implementing data governance practices for visualization integrity
- Identifying a comprehensive suite of tools for robust data lifecycle management
- Enabling automated refresh processes for timely information updates
- Preparing archiving strategies for historical data comparison and trend analysis
- Establishing documentation systems for maintaining visualization knowledge
Explore our cases



Data visualization consulting services across industries



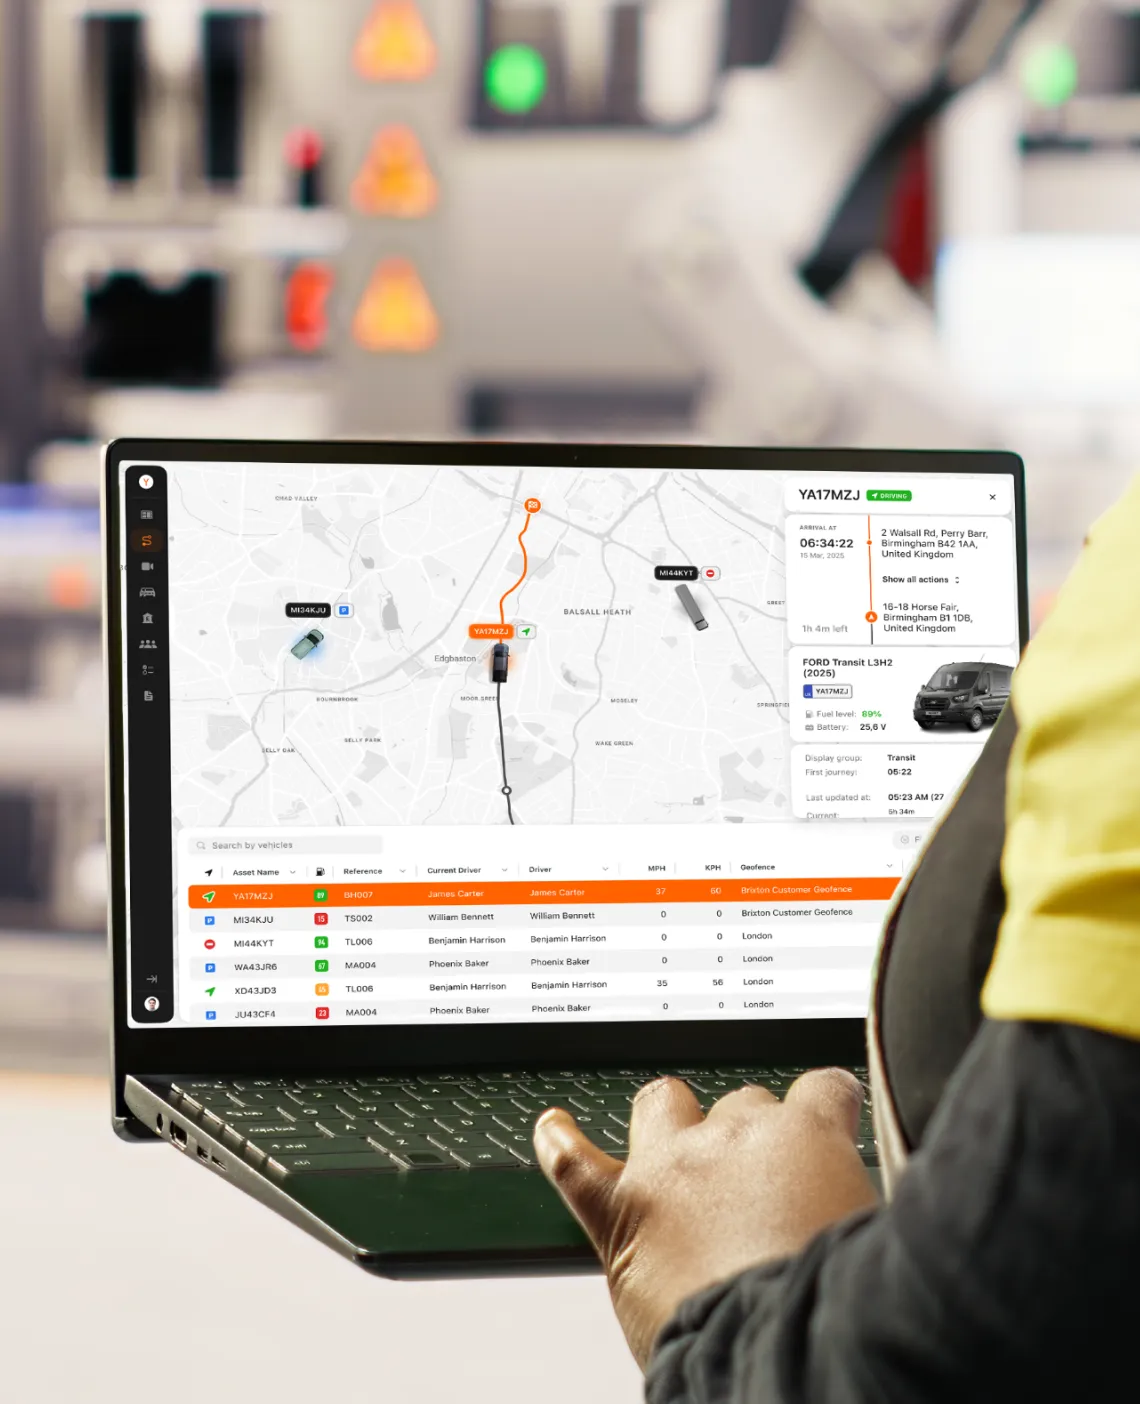


Make sense of your complex data
Drive business outcomes with data visualization services that improve business planning, power informed decisions, and optimize workflows.
Benefits of partnering with our data visualization company

Adaptive solutions
Tell us your goals—whether expanding market reach or optimizing existing operations—and we’ll create a visualization strategy that is aligned with your objectives.
Optimized resources
With our scalable and reliable data infrastructure and business intelligence management practices, you’ll get a custom approach to dealing with complex datasets.
Smarter operations
Stress- and hassle-free data analytics that constantly provide valuable insights enable better decision-making and more confidence in strategic planning.
Cost-effective implementation
Our team has developed flexible visualization frameworks that enable the cost-effective and secure implementation of the best-fit tools in the minimum amount of time.
Results-driven partnership
We integrate industry best practices with shared values and a commitment to excellence, coming up with data visualization solutions that contribute to your success.
Future-proof technology
With over 17 years of experience, we deliver solutions that not only address current business challenges but also adapt to changing market conditions and demands.
Advantages of data visualization consulting for your business

Performance at a glance
Empower your departments with interactive operational dashboards that visualize data on key performance indicators. Dynamic visualization transforms abstract employee performance metrics into intuitive visual formats, enabling staff at all levels to monitor performance trends and respond quickly to changes.

Strategic alignment
Support data-driven decisions and advance strategic planning by integrating advanced tools that reveal actionable insights. Well-designed visual analytics break down information silos and create a unified view of business performance that aligns teams around common goals.

Multiple perspectives
Analyze business insights from diverse perspectives with a variety of data visualization techniques. With complementary chart types and interactive elements, you’ll be able to discover hidden patterns and correlations that might go unnoticed in spreadsheets and reports.

Process visibility
Increase the visibility of your internal business processes, efficiently identify bottlenecks, and improve operational workflows. Targeted visual analysis and clear process visualization help pinpoint inefficiencies and measure the impact of improvements, creating a continuous feedback loop.

Quick comprehension
Transform complex datasets into visual formats that allow stakeholders to grasp key information in minutes. Effective data visualization dramatically reduces the cognitive load required to understand business information. It enables faster response times and more efficient communication across departments.

Audience engagement
Capture and maintain stakeholder attention with compelling visual storytelling that makes data memorable and persuasive. Well-crafted visualizations communicate complex business concepts with clarity and impact, making it easier to align teams around priorities and gain buy-in for strategic initiatives based on solid evidence.
Turn raw data into a game-changing tool
Create interactive dashboards to extract valuable insights, enhance reporting sessions, increase stakeholder buy-in, and align cross-company goals.
FAQ
-
What types of visual dashboards can Yalantis create?
We know how to create static reporting dashboards and dynamic, real-time monitoring solutions for various needs—from day-to-day control and self-service BI to deep data exploration and everything in between. Our data visualization services aren’t limited to a specific industry and span across domains. Regardless of the type, each dashboard is custom-built to address your challenges and provide an intuitive user experience.
-
Which data visualization tools and platforms do you use?
We select the most appropriate technology based on your infrastructure, data complexity, performance requirements, and the technical capabilities of your end users. Our data visualization consultants have extensive experience with industry-leading platforms such as Tableau, Microsoft Power BI, and QlikView. Our expertise also spans data warehouses, databases, data lakes, Rust, Python, C++, and other programming languages, frameworks, and so on.
-
Can you connect our real-time data streams to visual dashboards?
Yes, our data science experts can design and implement robust data pipelines that capture, process, and visualize streaming information with minimal latency. You’ll get responsive dashboards that automatically refresh as new intelligence arrives, displaying the most current information without manual updates. With intelligent buffering and aggregation, you’ll be able to manage high-volume data streams without sacrificing dashboard performance.
-
Do you design dashboards with end-users and non-technical staff in mind?
Absolutely! It’s one of the core principles of our data visualization advisory. We begin each project by understanding your business operations and the specific needs, technical comfort levels, and daily work tasks of all potential users. We pay much attention to intuitive layouts, clear visual hierarchies, and straightforward navigation paths, including contextual help features, interactive tooltips, etc.
-
How do you ensure scalability and performance in your data visualization solutions?
On the database side, we design optimized data models and efficient indexing strategies specifically for analytical workloads. For the frontend, we use efficient rendering techniques to handle large datasets without browser performance degradation. We build intelligent data loading mechanisms that fetch information incrementally or on demand and architect solutions with caching layers, load balancing, and horizontal scaling capabilities.
-
Can you create interactive visualizations that support data exploration?
Yes, we can create highly interactive visualizations that allow users to drill down from summary views into granular details, filter datasets to focus on specific segments, and pivot between different analytical perspectives. Our visualization solutions can incorporate predictive elements, allowing users to test scenarios by manipulating variables and immediately see projected outcomes.
-
Is it possible to embed your visual dashboards into our internal apps or portals?
Yes, our data visualization services consider embedding from the start. All components our team creates can be incorporated into web applications, enterprise portals, CRM systems, or a custom business platform. The embedded visualizations maintain consistent branding and user experience with your host application while providing the full interactive functionality of standalone dashboards.
How to get started with Yalantis
Leave your info and a few words about the project. We’ll review it and reach out to book a call.
Welcome to Yalantis, please fill out the form and we’ll get back to you.

Thank you for contacting us.
Keep an eye on your inbox. We’ll be in touch shortly
Meanwhile, you can explore our hottest case studies and read
client feedback on Clutch.